Category:GMS Plots: Difference between revisions
From XMS Wiki
Jump to navigationJump to search
(Created page with "Articles and images related to plots in GMS. Category:GMS General Information Category:Plots") |
No edit summary |
||
| Line 3: | Line 3: | ||
[[Category:GMS General Information]] | [[Category:GMS General Information]] | ||
[[Category:Plots]] | [[Category:Plots]] | ||
[[Category:Observations]] | |||
[[Category:Calibration]] | |||
Revision as of 15:45, 10 January 2017
Articles and images related to plots in GMS.
Subcategories
This category has the following 3 subcategories, out of 3 total.
Pages in category "GMS Plots"
The following 5 pages are in this category, out of 5 total.
Media in category "GMS Plots"
The following 32 files are in this category, out of 32 total.
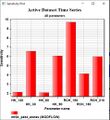
- Active data time series plot.jpg 604 × 438; 67 KB
- Calib b.png 1,440 × 900; 122 KB
- Calib plot.png 687 × 503; 27 KB
- Calib w.png 1,440 × 900; 122 KB
- Chd.PNG 1,518 × 849; 59 KB
- Comp v obs plot.jpg 569 × 460; 68 KB
- Comp v obs wt plot.jpg 633 × 494; 79 KB
- Discretization01.jpg 908 × 708; 48 KB
- Err summary plot.jpg 702 × 248; 22 KB
- Err v timestep plot.png 619 × 450; 29 KB
- Error v sim plot.jpg 948 × 516; 84 KB
- ErrorSummary.png 562 × 156; 3 KB
- Ets xy 1.png 899 × 604; 12 KB
- Ets xy 2.png 899 × 604; 12 KB
- Flow plot.jpg 1,000 × 436; 128 KB
- Flowbudgetplot.jpg 560 × 418; 74 KB
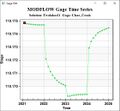
- Gage pv v time plot.jpg 559 × 516; 61 KB
- GMS Axes Display 10.png 733 × 573; 22 KB
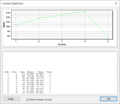
- Horizons Optimizer.png 686 × 593; 21 KB
- Markov chain plot.png 896 × 500; 54 KB
- Markov chains x.png 925 × 732; 44 KB
- Markov chains z.png 925 × 732; 56 KB
- Markov graphs.png 465 × 599; 75 KB
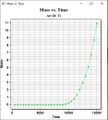
- Mass v time plot.jpg 466 × 516; 59 KB
- Ofr00-466 1.png 1,059 × 850; 62 KB
- Par sen plot.jpg 473 × 516; 69 KB
- Plot values.png 600 × 323; 233 KB
- Res v obs plot.jpg 594 × 516; 66 KB
- Res v obs wt plot.jpg 620 × 469; 74 KB
- Time series plot.jpg 608 × 448; 61 KB
- TinModflow6.png 736 × 583; 44 KB
- Wt plot1.png 545 × 412; 6 KB


