CW:CityWater Project Map: Difference between revisions
| Line 78: | Line 78: | ||
|valign="top"| | |valign="top"| | ||
* Label | * Label | ||
* Type | |||
* Reservoir Head | |||
* Simulation Time | |||
* Note | |||
|valign="top"| | |valign="top"| | ||
* Label | * Label | ||
Revision as of 16:14, 14 February 2017
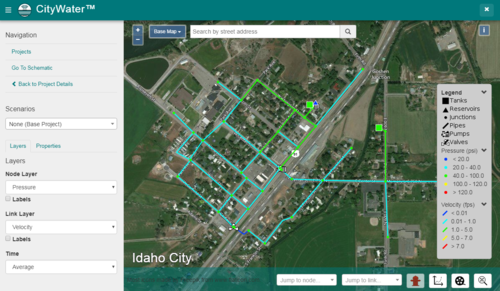
The Map page displays an aerial map of the project area with the pipe network overlaying the area. This page can be reached from either the Projects page or the Project Details page using the Map tab.
Map navigation similar to other mapping applications:
- To zoom in or out, use the
 and
and  buttons in the top left-hand corner of the map or use the mouse scroll wheel.
 - Hold the Shift key while clicking and dragging the mouse to box zoom.
- To frame the model extents on the map, use the Zoom to Extent button in the bottom left hand corner of the screen.
Map Legend
In the lower right corner, the legend is shown. The legend shows the element symbols being displayed in the map. Values shown in the legend depends on the options selected in the Layers tab on the left side of the screen. Values in the legend can be hidden by clicking on the down arrow ![]() next to the value category name.
next to the value category name.
Plot
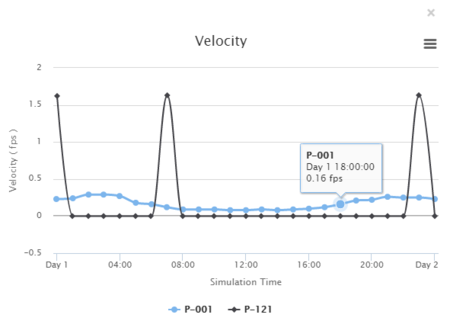
When an element has been selected, CityWater can generate a plot based on the element temporal properties. Clicking the Plot button will bring up a plot on the lower half of the screen. This will display a plot of the variable versus time for the selected element. If you select multiple elements and press the Plot button, a time series for each selected element will be plotted.
Using your mouse to roll over specific plot points will bring up a dialog showing the values for the plot point.
Plots can be exported as an image. Clicking the menu ![]() button in the corner of the plot will bring up export options. Plots can be saved in PNG, JPEG, PDF, or SVG file formats.
button in the corner of the plot will bring up export options. Plots can be saved in PNG, JPEG, PDF, or SVG file formats.
Layers Selection
The Layers tab, in the lower left portion of the window, allows selecting which attributes to display in the map area.
There are several different layers that you can view on the map. You can toggle through the different layers using the Layer controls.
- Select the Layers tab from the left hand panel to access e Layer controls. If the left hand panel is hidden, you can show it by using the
 menu button, located in the top left hand corner of the page.
 - Select Node from the Node Variable drop down menu and Links from the Link Variable drop down menu.
Notice how the symbology on the map and legend change. The Node and Link layers represent the network geometry with no simulation result values symbolized, which is why all the nodes and links are white.
Properties
After selecting a feature, the Properties tab on the lower left side of the screen will display the values associated with the feature. Typical values shown are:
| Feature | Junctions | Pipe | Pump | Reservoirs | Tank | Valves |
|---|---|---|---|---|---|---|
| Values |
|
|
|
|
|
|
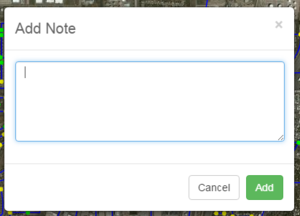
Add a note to any element by selecting it and pressing the Add button next to the Note property in the Properties tab on the left. Enter your note in the Add Note dialog that appears and press the Add button to save it.
View all of the annotations on the map by going back to the Project Details page and selecting the Map tab. The annotations are listed based on element type. Use the search boxes to find specific annotations.
Related Topics
CityWater | ||
|---|---|---|
| Articles: | Overview • Project Details • Project Map • Project Schematic • Scenarios • User Management |  |
| Support: | Tutorials • Convert NET File • What's New in CityWater • Release Notes • Terms and Conditions | |
| Aquaveo | ||


