SMS:Quick Tour - Visualization: Difference between revisions
From XMS Wiki
Jump to navigationJump to search
mNo edit summary |
No edit summary |
||
| (4 intermediate revisions by the same user not shown) | |||
| Line 1: | Line 1: | ||
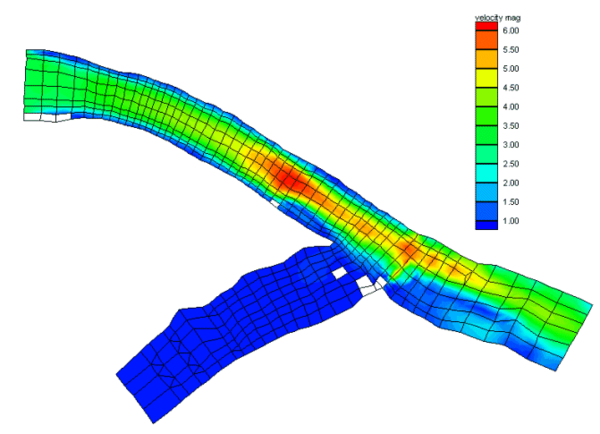
SMS provides a powerful suite of tools for generating professional looking quickly and easily. The following figure illustrates a contour plot of velocity magnitude with a user specified color ramp. | SMS provides a powerful suite of tools for generating professional looking quickly and easily. The following figure illustrates a contour plot of velocity magnitude with a user specified color ramp. | ||
[[Image: | [[Image:SMS VisualizationQuick.png|600 px]] | ||
[[SMS:Quick Tour - Data Calculator| '''< Previous''']] | [[SMS:Quick Tour - Animation| ''' Next >''']] | [[SMS:Quick Tour - Data Calculator| '''< Previous''']] | [[SMS:Quick Tour - Animation| ''' Next >''']] | ||
[[Category:SMS Quick Tour]] | |||
{{Navbox SMS Quick}} | |||
[[Category:SMS Quick Tour|Visual]] | |||
[[Category:SMS Display Options]] | |||
Latest revision as of 15:47, 31 March 2017
SMS provides a powerful suite of tools for generating professional looking quickly and easily. The following figure illustrates a contour plot of velocity magnitude with a user specified color ramp.
| [hide] SMS – Quick Tour | ||
|---|---|---|
| Overview | Intro • Layout • Menu • Project Explorer • Edit Strip • Module • Tools • Macros • Help Strip • Background Images |  |
| Conceptual Models | Conceptual Models • Feature Objects • Network Creation • Polygon Attributes • Feature Stamping • Model Conversion | |
| Models | USACE-WAS Models • USACE-WAS to Learn More • FHWA Models • FESWMS to Learn More • Generic Model | |
| Functionalities | Coordinate Conversions • Scattered Data • Filtering • Calibration • Calibration Targets • Profiles • Observation Coverage • Data Calculator • Visualization • Animation • Support | |
| Aquaveo • SMS Tutorials • SMS Workflows | ||
