User:Kczappa: Difference between revisions
No edit summary |
|||
| (25 intermediate revisions by 2 users not shown) | |||
| Line 1: | Line 1: | ||
'''Kayla Czappa''' | '''Kayla Czappa''' | ||
[[User:Kczappa/CW:CityWater FAQ]] | |||
===CityWater Model Runs=== | |||
When performing model runs with CityWater, it is common to see a lag in the amount of time it takes to process the run. When there are too many runs to perform simultaneously, CityWater uses a scheduling system to sort the model runs. To ensure that each product can get processed effectively without crashing, CityWater was designed to organize each run into a waiting queue which can be the cause of longer run times. | |||
'''Three reasons why run times might be longer:''' | |||
1. Writing the results to the database – CityWater must be able to access results. Therefore, some of the time used to execute the run goes towards writing the results to the database so that the CityWater app can find and access the data that is needed. | |||
2. Performing extra analysis – One of the reasons it takes CityWater longer to run than in Epanet is because CityWater has to generate the zone, pressure swing, and peak-day fire flow layers which aren't offered in Epanet. This creates a longer wait time for each run. | |||
3. Generating the visualization layers – CityWater uses visualization layers to display the model on the map which takes more time to generate and leads to a longer run time. | |||
'''Running Scenarios''' | |||
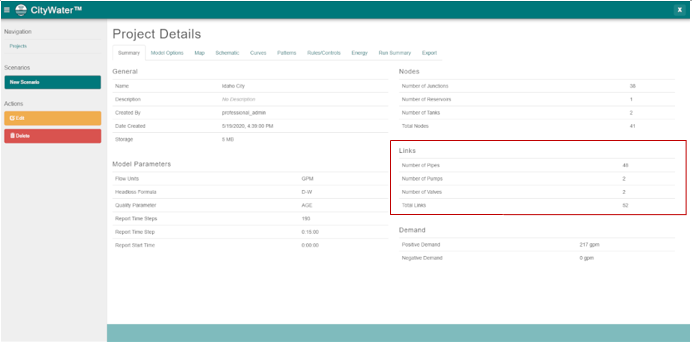
Since not all of the steps above are necessary while running scenarios, it is more common for a scenario to run faster than the initial upload. Running the scenario, however, should take roughly the same amount of time as it would for the initial model upload. Both the number of pipes and the number of time steps contained within the model will increase the amount of time it takes to run the model. This is due to the fact that the size of the model increases accordingly. The suggested amount of pipes for a given project is roughly around 10,000 to 15,000 pipes and 100 time steps. At this time, CityWater best performs under these parameters. | |||
'''Ways to better the outcome of larger scale models:''' | |||
[[File:CityWater_Project_Details.PNG|700 px|Example of the Project Details page]] | |||
1. Reducing the number of pipes within the model – An accurate Epanet model is not always contingent on a high number of pipes. Therefore, it is likely that reducing the pipes in a the model will still be effective. | |||
2. Reduce the number of time steps within the model – When working with a larger model, it might be effective to reduce the typical 24 hours with a 15 minute time steps to an hourly time step over a span of 24 hours. | |||
3. Use the Viewing options – In a model, the exclusion of the Scenario, Fire Flow, or Schematic add-ons could benefit the project. With use of only the visualization capabilities, the model can still function, even with larger projects, because they are not highly influenced by the size of the model. | |||
Links to finish: | |||
https://www.xmswiki.com/wiki/WMS:File_Import_Wizard#Step_1_.E2.80.93_File_Outline | |||
===WMS: Edit HEC-1 Parameters dialog=== | ===WMS: Edit HEC-1 Parameters dialog=== | ||
[[Image:Edit HEC-1 Parameters. | [[Image:Edit HEC-1 Parameters.png|thumb|470 px|''Edit HEC-1 Parameters'' dialog]] | ||
When a basin is selected in the HEC-1 model, selecting ''HEC-1'' | '''Edit Parameters''' will bring up the ''Edit HEC-1 Parameters'' dialog with the ''Basin HEC-1 Cards'' section active. The following can then be specified: | When a basin is selected in the HEC-1 model, selecting ''HEC-1'' | '''Edit Parameters''' will bring up the ''Edit HEC-1 Parameters'' dialog with the ''Basin HEC-1 Cards'' section active. The following can then be specified: | ||
| Line 134: | Line 132: | ||
==Channel Data Dialog== | ==Channel Data Dialog== | ||
=='''Define Reservoir Data''' – Select to open ''Define Reservoir Data'' dialog.== | =='''Define Reservoir Data''' – Select to open ''Define Reservoir Data'' dialog.== | ||
| Line 329: | Line 144: | ||
https://www.xmswiki.com/wiki/WMS:TR-20_Reservoir_Data | https://www.xmswiki.com/wiki/WMS:TR-20_Reservoir_Data | ||
==Editing HY8:Controlling Plot Display Options== | |||
https://www.xmswiki.com/index.php?title=HY8:Controlling_Plot_Display_Options&action=edit | |||
Latest revision as of 22:13, 13 July 2020
Kayla Czappa
CityWater Model Runs
When performing model runs with CityWater, it is common to see a lag in the amount of time it takes to process the run. When there are too many runs to perform simultaneously, CityWater uses a scheduling system to sort the model runs. To ensure that each product can get processed effectively without crashing, CityWater was designed to organize each run into a waiting queue which can be the cause of longer run times.
Three reasons why run times might be longer:
1. Writing the results to the database – CityWater must be able to access results. Therefore, some of the time used to execute the run goes towards writing the results to the database so that the CityWater app can find and access the data that is needed.
2. Performing extra analysis – One of the reasons it takes CityWater longer to run than in Epanet is because CityWater has to generate the zone, pressure swing, and peak-day fire flow layers which aren't offered in Epanet. This creates a longer wait time for each run.
3. Generating the visualization layers – CityWater uses visualization layers to display the model on the map which takes more time to generate and leads to a longer run time.
Running Scenarios
Since not all of the steps above are necessary while running scenarios, it is more common for a scenario to run faster than the initial upload. Running the scenario, however, should take roughly the same amount of time as it would for the initial model upload. Both the number of pipes and the number of time steps contained within the model will increase the amount of time it takes to run the model. This is due to the fact that the size of the model increases accordingly. The suggested amount of pipes for a given project is roughly around 10,000 to 15,000 pipes and 100 time steps. At this time, CityWater best performs under these parameters.
Ways to better the outcome of larger scale models:
1. Reducing the number of pipes within the model – An accurate Epanet model is not always contingent on a high number of pipes. Therefore, it is likely that reducing the pipes in a the model will still be effective.
2. Reduce the number of time steps within the model – When working with a larger model, it might be effective to reduce the typical 24 hours with a 15 minute time steps to an hourly time step over a span of 24 hours.
3. Use the Viewing options – In a model, the exclusion of the Scenario, Fire Flow, or Schematic add-ons could benefit the project. With use of only the visualization capabilities, the model can still function, even with larger projects, because they are not highly influenced by the size of the model.
Links to finish:
https://www.xmswiki.com/wiki/WMS:File_Import_Wizard#Step_1_.E2.80.93_File_Outline
WMS: Edit HEC-1 Parameters dialog
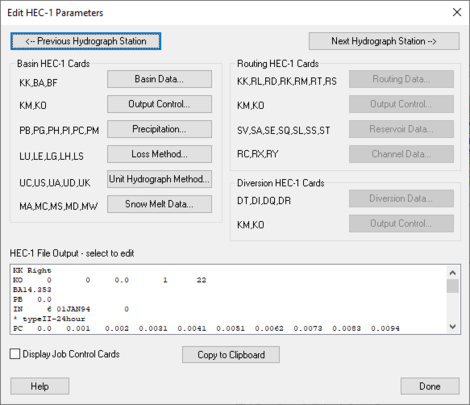
When a basin is selected in the HEC-1 model, selecting HEC-1 | Edit Parameters will bring up the Edit HEC-1 Parameters dialog with the Basin HEC-1 Cards section active. The following can then be specified:
<--Previous Hydrograph Station –
Next Hydrograph Station--> –
Basin HEC-1 Cards section –
- Basin Data... – Allows the specification of Basin Data.
- KK – Basin Name.
- BA – Basin Area.
- BF – Baseflow.
- Output Control... – Allows different output controls to be specified.
- KM – Comment Lines.
- KO – Output Control.
- Precipitation... – Allows the specification of precipitation data.
- PB – Basin Average Precipitation.
- PG – Precipitation Gage.
- PH – Hypothetical Storm.
- PI – Probable Maximum Precipitation.
- PC –
- PM –
- Loss Method... – Allows the specification of Loss Methods being applied.
- LU – Uniform Loss Method.
- LE – Exponential Loss
- LG – Green & Ampt.
- LH – Holtan.
- LS – SCS Loss Method.
- Unit Hydrograph Method... – Allows the specification of Hydrograph methods being applied.
- UC – Clark Unit Hydrograph.
- US – Snyder
- UA –
- UD – SCS Dimensionless.
- UK – Kinematic Wave.
- Snow Melt Data... – Allows the specification of snow melt data.
- MA – Elevation Zone Data.
- MC –
- MS – Shot-Wave Radiation Time Series.
- MD – Dew Point Time Series.
- MW – Wind Speed Time Series.
Routing HEC-1 Cards section –
- Routing Data... – Allows the specification of routing data.
- KK – Outlet Names.
- RL – Channel Losses.
- RD – Muskingum-Cunge.
- RK – Kinematic Wave.
- RM – Muskingum.
- RT – Straddler Stagger.
- RS – Storage Routing.
- Output Control... – Allows different output controls to be specified.
- KM – Comment Lines.
- KO – Output Control.
- Reservoir Data... – Allows the specification of reservoir data.
- SV – Volume.
- SA – Area.
- SE – Elevation.
- SQ – Outflow.
- SL – Low-Level Outlet.
- SS – Spillway Characteristics.
- ST – Dam Overtopping.
- Channel Data... – Allows the specification of Channel data.
- AC –
- RX –
- RY –
Diversion HEC-1 Cards section –
- Diversion Data... – Allows the specification of diversion data.
- DT – Editing Diversion Data.
- DI – Inflow.
- DQ – Outflow.
- DR –
- Output Control... – Allows different output controls to be specified.
- KM – Comment Lines.
- KO – Output Control.
HEC-1 File Output-select to edit section –
"Display Job Control Cards" – By selecting this, it allows the Job Controls to be viewed.
Copy to Clipboard – Allows the information to be copied to the clipboard for any future use.
Help –
Channel Data Dialog
Define Reservoir Data – Select to open Define Reservoir Data dialog.
Related Links:
https://www.xmswiki.com/wiki/WMS:TR-20_Reservoir_Data
Reservoir Output Control – Select to open Reservoir Output Control dialog.
Related Links:
https://www.xmswiki.com/wiki/WMS:TR-20_Reservoir_Data
Editing HY8:Controlling Plot Display Options
https://www.xmswiki.com/index.php?title=HY8:Controlling_Plot_Display_Options&action=edit

