GMS:Plot Options Dialog: Difference between revisions
From XMS Wiki
Jump to navigationJump to search
No edit summary |
Tag: Manual revert |
||
| (4 intermediate revisions by the same user not shown) | |||
| Line 1: | Line 1: | ||
[[File:GMS_Plot_Options_Optns.jpg|thumb|300px|''Options'' tab of the ''Plot Options'' dialog.]] | [[File:GMS_Plot_Options_Optns.jpg|thumb|300px|''Options'' tab of the ''Plot Options'' dialog.]] | ||
The ''Plot Options'' dialog is used to adjust the axes plot options | The ''Plot Options'' dialog is used to adjust the axes plot options for borehole sample data plots and the display in the [[GMS:Borehole Cross Sections#Borehole_Cross_Section_Editor|''Cross Section Editor'']]. For borehole sample data plots, it is accessed through the '''Plot Options…''' button on the [[GMS:Borehole Display Options|''Borehole data'']] tab of the [[GMS:Display Options|''Display Options'']] dialog. For the ''Cross Section Editor'', it's accessed through the '''Plot Options''' tool. This dialog has the following options: | ||
==Options tab== | ==Options tab== | ||
| Line 19: | Line 19: | ||
* ''Top'' – Options to set what displays along the top axis of the plot. | * ''Top'' – Options to set what displays along the top axis of the plot. | ||
* ''Bottom'' – Options to set what displays along the bottom axis of the plot. | * ''Bottom'' – Options to set what displays along the bottom axis of the plot. | ||
Both ''Top'' and ''Bottom'' have these options: | ::Both ''Top'' and ''Bottom'' have these options: | ||
:* ''Display axis'' – Displays this axis in the plot. | :* ''Display axis'' – Displays this axis in the plot. | ||
:* ''Display ticks'' – Displays tick marks along this axis. | :* ''Display ticks'' – Displays tick marks along this axis. | ||
| Line 35: | Line 35: | ||
** ''Label every Nth tick(s)'' – Sets the interval at which ticks are labeled with their numerical values along the x-axis when ''Auto scale'' is off. | ** ''Label every Nth tick(s)'' – Sets the interval at which ticks are labeled with their numerical values along the x-axis when ''Auto scale'' is off. | ||
** ''Grid every Nth ticks(s)'' – Sets the interval at which ticks have grid lines along the x-axis when ''Auto scale'' is off. Grid lines only display if ''Display grid'' is turned on. | ** ''Grid every Nth ticks(s)'' – Sets the interval at which ticks have grid lines along the x-axis when ''Auto scale'' is off. Grid lines only display if ''Display grid'' is turned on. | ||
==Y-axis tab== | ==Y-axis tab== | ||
| Line 42: | Line 41: | ||
* ''Left'' – Options to set what displays along the left axis of the plot. | * ''Left'' – Options to set what displays along the left axis of the plot. | ||
* ''Right'' – Options to set what displays along the right axis of the plot. | * ''Right'' – Options to set what displays along the right axis of the plot. | ||
Both ''Left'' and ''Right'' have these options: | ::Both ''Left'' and ''Right'' have these options: | ||
:* ''Display axis'' – Displays this axis in the plot. | :* ''Display axis'' – Displays this axis in the plot. | ||
:* ''Display ticks'' – Displays tick marks along this axis. | :* ''Display ticks'' – Displays tick marks along this axis. | ||
Latest revision as of 22:17, 5 April 2022
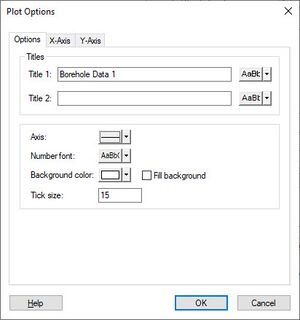
The Plot Options dialog is used to adjust the axes plot options for borehole sample data plots and the display in the Cross Section Editor. For borehole sample data plots, it is accessed through the Plot Options… button on the Borehole data tab of the Display Options dialog. For the Cross Section Editor, it's accessed through the Plot Options tool. This dialog has the following options:
Options tab
The Options tab contains options that pertain to the entire plot.
- Titles
- Title 1 – Sets the text and font settings for the first title that will appear above the plot. Click on the gray button next to the desired title to open a Font dialog to set the font settings.
- Title 2 – Sets the text and font settings for the second title that will appear above the plot. Click on the gray button next to the desired title to open a Font dialog to set the font settings.
- Axis – Click the gray button to open a Line Properties dialog to set the display options for the axis of the plot.
- Number font – Click the gray button to open a Font dialog for adjusting the font display options of the numbers shown on the plot.
- Background color – Click the gray button to open a Color dialog for adjusting the desired background color for the plot. This option is not adjustable for the plots of borehole sample data. It is adjustable for plots in the Cross Section Editor.
- Fill background
- Tick size – Adjusts the size of the tick marks on the axes.
X-axis tab
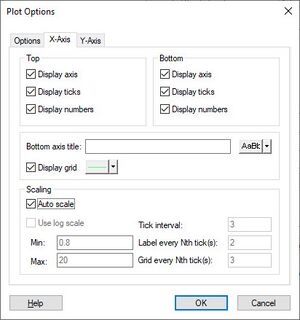
The X-axis tab has the following options:
- Top – Options to set what displays along the top axis of the plot.
- Bottom – Options to set what displays along the bottom axis of the plot.
- Both Top and Bottom have these options:
- Display axis – Displays this axis in the plot.
- Display ticks – Displays tick marks along this axis.
- Display numbers – Displays the numerical values along this axis.
- Bottom axis title – Displays the name for the bottom axis. Click the gray box to the right to open a Font dialog to adjust the font display options for the axis title. Not functional with borehole sample data plots.
- Display grid – Displays grid lines starting at the bottom axis that cover the whole plot. Click the gray box to the left to open a Line Properties dialog to adjust the display options for the grid lines.
- Scaling
- Auto scale – The plot will automatically adjust tick intervals and the minimum and maximum numbers for the x-axis when zoom and pan are used to adjust the plot display. When off, the x-axis is frozen. In the Cross Section Editor, this means the plot cannot be moved horizontally. For borehole sample data displayed in the Graphics Window, this means the x-axis maintains a consistent set of intervals regardless of the level of zoom.
- Use log scale – Uses a logarithmic scale to determine the values along a the x-axis. Values along the x-axis less than or equal to zero will cause an error message. Not available on the Cross Section Editor.
- Min – The minimum value for the x-axis to display when Auto scale is off.
- Max – The maximum value for the x-axis to display when Auto scale is off.
- Tick interval – The interval at which ticks display on the x-axis when Auto scale is off.
- Label every Nth tick(s) – Sets the interval at which ticks are labeled with their numerical values along the x-axis when Auto scale is off.
- Grid every Nth ticks(s) – Sets the interval at which ticks have grid lines along the x-axis when Auto scale is off. Grid lines only display if Display grid is turned on.
Y-axis tab
The Y-axis tab has the following options:
- Left – Options to set what displays along the left axis of the plot.
- Right – Options to set what displays along the right axis of the plot.
- Both Left and Right have these options:
- Display axis – Displays this axis in the plot.
- Display ticks – Displays tick marks along this axis.
- Display numbers – Displays the numerical values along this axis.
- Left axis title – Displays the name for the left axis. Click the gray box to the right to open a Font dialog to adjust the font display options for the axis title. Not functional with borehole sample data plots.
- Display grid – Displays grid lines starting at the left axis that cover the whole plot. Click the gray box to the left to open a Line Properties dialog to adjust the display options for the grid lines.
- Scaling
- Auto scale – The plot will automatically adjust tick intervals and the minimum and maximum numbers for the y-axis when zoom and pan are used to adjust the plot display. When off, the y-axis is frozen. In the Cross Section Editor, this means the plot cannot be moved vertically. For borehole sample data displayed in the Graphics Window, this means the y-axis maintains a consistent set of intervals regardless of the level of zoom.
- Use log scale – Uses a logarithmic scale to determine the values along the y-axis. Values along the y-axis less than or equal to zero will cause an error message. Not available on the Cross Section Editor.
- Min – The minimum value for the y-axis to display when Auto scale is off.
- Max – The maximum value for the y-axis to display when Auto scale is off.
- Tick interval – The interval at which ticks display on the y-axis when Auto scale is off.
- Label every Nth tick(s) – Sets the interval at which ticks are labeled with their numerical values along the y-axis when Auto scale is off.
- Grid every Nth ticks(s) – Sets the interval at which ticks have grid lines along the y-axis when Auto scale is off. Grid lines only display if Display grid is turned on.

