CW:CityWater Project Details: Difference between revisions
No edit summary |
|||
| (27 intermediate revisions by 3 users not shown) | |||
| Line 3: | Line 3: | ||
On the left side of the page are a few buttons. | On the left side of the page are a few buttons. | ||
* '''New Scenario''' – This button is only available for administrative accounts. It allows creating new [[CityWater Scenarios|scenarios]] for an existing project. After a project has scenarios generated, a drop-down menu listing all the scenarios becomes available. | * '''New Scenario''' – This button is only available for administrative accounts. It allows creating new [[CityWater Scenarios|scenarios]] for an existing project. After a project has scenarios generated, a drop-down menu listing all the scenarios becomes available. Selecting a scenario changes the rest of the Project Details page to reflect data from the selected scenario. | ||
* '''Run''' – This button is only available for administrative accounts. This button becomes active when a change has been made for the selected scenario. The '''Run''' button then must be used in order for the Project Details page to reflect the changes. | * '''Run''' – This button is only available for administrative accounts. This button becomes active when a change has been made for the selected scenario. The '''Run''' button then must be used in order for the Project Details page to reflect the changes. | ||
* '''Edit''' – This button brings up the [[CityWater_Overview#Create_a_New_Project|Edit Project]] page which is similar to the Create New Project page having the same options. This allows changing the project name, details, and other information that was entered when the project was created. | * '''Edit''' – This button brings up the [[CityWater_Overview#Create_a_New_Project|Edit Project]] page which is similar to the Create New Project page having the same options. This allows changing the project name, details, and other information that was entered when the project was created. | ||
| Line 13: | Line 13: | ||
'''''General''''' | '''''General''''' | ||
* Name | * Name – The name of the project. | ||
* Description | * Description – A description of the project. | ||
* Created By | * Created By – The username of the person who created the project. | ||
* Date Created | * Date Created – The date on which the project was created. | ||
* Storage | * Storage – How much storage space the project files use. | ||
'''''Model Parameters''''' | '''''Model Parameters''''' | ||
*Flow Units | *Flow Units – The amount of water flowing from CityWater Pumps. | ||
*Headloss Formula | *Headloss Formula – Determining the discharge. | ||
*Quality Parameter | *Quality Parameter – Parameters for water quality measured in AGE. | ||
*Report Time Steps | *Report Time Steps – Number of time steps. | ||
*Report Time Step | *Report Time Step – Time of report. | ||
*Report Start Time | *Report Start Time – Start time of the report. | ||
'''''Nodes''''' | '''''Nodes''''' | ||
* Number of Junctions | * Number of Junctions – Total amount of junctions in the model. | ||
* Number of Reservoirs | * Number of Reservoirs – Total amount of reservoir in the model. | ||
* Number of Tanks | * Number of Tanks – Total number of tanks in the model. | ||
* Total Nodes | * Total Nodes – Number of nodes in the model. | ||
'''''Links''''' | '''''Links''''' | ||
* Number of Pipes | * Number of Pipes – Total number of pipes in the model. | ||
* Number of Pumps | * Number of Pumps – Total number of pumps in the model. | ||
* Number of Valves | * Number of Valves – Total number of valves in the model. | ||
* Total Links | * Total Links | ||
'''''Demand''''' | '''''Demand''''' | ||
* Positive Demand | * Positive Demand – The positive coefficient expected for the given area. | ||
* Negative Demand | * Negative Demand – The negative coefficient expected for the given area. | ||
==Changes== | ==Changes== | ||
The Changes tab only appears for scenarios. Select a scenario to access this tab. The tab displays a list of differences between the base model and the scenario. Changes are organized in to changes to the global options, time options, nodes, or links. Changes to nodes and links will contain a hyperlink to jump to | The Changes tab only appears for scenarios. Select a scenario to access this tab. The tab displays a list of differences between the base model and the scenario. Changes are organized in to changes to the global options, time options, nodes, or links. Changes to nodes and links will contain a hyperlink to jump to that particular link or node in the project map. | ||
[[File:CityWaterProjectChanges.png|thumb|none|600 px|Example of the Changes tab on the Project Details page]] | [[File:CityWaterProjectChanges.png|thumb|none|600 px|Example of the Changes tab on the Project Details page]] | ||
| Line 55: | Line 55: | ||
==Model Options== | ==Model Options== | ||
The Model Options tab allows viewing and changing parameters for | The Model Options tab allows viewing and changing parameters for the model run. For the base model, the options can only be viewed. For simulations, the options can be changed by clicking the '''Edit''' button. | ||
[[File:CityWaterProjectModelOptions.png|thumb|none|600 px|Example of the Model Options tab on the Project Details page]] | [[File:CityWaterProjectModelOptions.png|thumb|none|600 px|Example of the Model Options tab on the Project Details page]] | ||
| Line 61: | Line 61: | ||
'''Global Options''' | '''Global Options''' | ||
* Accuracy | * Accuracy – The accuracy of the project. | ||
* Check Frequency | * Check Frequency – The frequency of the check. | ||
* Damp Limit | * Damp Limit – The allowed level of damp for the project. | ||
* Default Demand Pattern | * Default Demand Pattern – The default demand pattern assigned to the model. | ||
* Demand Multiplier | * Demand Multiplier – Indicates by how much the maximum day demand should be multiplied. | ||
* Diffusivity | * Diffusivity – The amount of diffusion admitted. | ||
* Emitter Exponent | * Emitter Exponent – The measurement of the pressure and the discharge. | ||
* Headloss | * Headloss – The amount of energy lost in the process. | ||
* Max Check | * Max Check – The max check for the project. | ||
* Pressure | * Pressure – Amount of pressure. | ||
* Quality Chemical Units | * Quality Chemical Units – Amount of quality chemical units found in the project. | ||
* Quality Method | * Quality Method – The quality method used for the project. | ||
* Quality Trace Node | * Quality Trace Node – | ||
* Specific Gravity | * Specific Gravity – The gravity specified for the project area. | ||
* Tolerance | * Tolerance – The tolerance specified for the project. | ||
* Trials | * Trials – Trials run. | ||
* Unbalanced Method | * Unbalanced Method – Active method. | ||
* Unbalanced N | * Unbalanced N – The amount of unbalanced force affecting the project. | ||
* Units | * Units – The units used in the project. | ||
* Viscosity | * Viscosity – The viscosity of the water within the area. | ||
'''Time Options''' | '''Time Options''' | ||
| Line 107: | Line 107: | ||
This section will show any notes or annotations added to the map. | This section will show any notes or annotations added to the map. | ||
* Nodes – Will show a list of annotations attached to nodes on the project map page. | * Nodes – Will show a list of annotations attached to nodes on the project map page. | ||
* Text – Lists details regarding the node and the link. | |||
* Modified – Lists details pertaining to the modifications made. | |||
* By – Lists who contributed to the modifications. | |||
* Links – Will show a list of annotations attached to links on the project map page. | * Links – Will show a list of annotations attached to links on the project map page. | ||
Clicking on the node or link name will take you to the project map page with the node or link selected. The text of the annotation will be shown along with when the annotation was last modified and who modified it. | Clicking on the node or link name will take you to the project map page with the node or link selected. The text of the annotation will be shown along with when the annotation was last modified and who modified it. | ||
| Line 114: | Line 117: | ||
'''''Map Preview''''' | '''''Map Preview''''' | ||
This section shows a scaled down image of the pipe network in the project Map page. | This section shows a scaled-down image of the pipe network in the project Map page. | ||
==Schematic== | |||
[[File:Project_Details_Schematic_3.PNG|thumb|650 px|Example of the Schematic tab in the Project Details page]] | |||
'''Go To Schematic''' – This will open the schematic page to allow for the altering of the display of different attributes associated with the project. | |||
'''Threshold Settings''' – This will open up the option to edit inefficiency thresholds. | |||
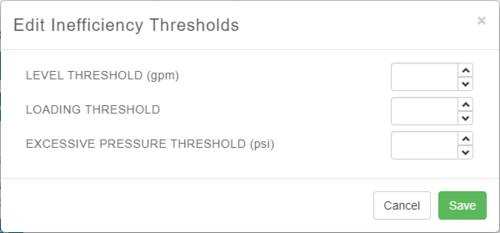
[[File:Edit_inefficiency_Threshholds_CityWater.PNG|500 px|Example of the Threshold Settings in the Project Details page]] | |||
*''LEVEL THRESHOLD (gpm)'' – Use the arrow buttons, up and down, to choose the level threshold. | |||
*''LOADING THRESHOLD'' – Use the arrow buttons, up and down, to choose the loading threshold. | |||
*''EXCESSIVE PRESSURE THRESHOLD (psi)'' Use the arrow buttons, up and down, to choose the excessive pressure threshold. | |||
'''Run Analysis''' – This option allows you to run and view the specs on the schematic map. | |||
'''New Scenario''' – Select this to create a new scenario. | |||
'''Edit''' – With this selection, you can edit project details. | |||
'''Delete''' – With this selection, you can delete project details. | |||
==Curves== | ==Curves== | ||
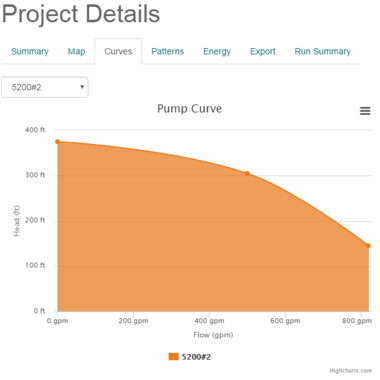
[[File:CityWaterProjectCurve.png|thumb|380 px|Example of the Curves tab on the Project Details page]] | [[File:CityWaterProjectCurve.png|thumb|380 px|Example of the Curves tab on the Project Details page]] | ||
The Curves tab displays a curve graph for the selected pump. Select the pump curve to display from the drop down menu in upper left portion of the tab. Clicking the [[File:Menu Icon.png|16 px]] icon in the upper right portion of the tab will bring up a menu with commands for printing the graph or downloading the graph as an image file. | The Curves tab displays a curve graph for the selected pump. Select the pump curve to display from the drop-down menu in the upper-left portion of the tab. Clicking the [[File:Menu Icon.png|16 px]] icon in the upper right portion of the tab will bring up a menu with commands for printing the graph or downloading the graph as an image file. | ||
==Patterns== | ==Patterns== | ||
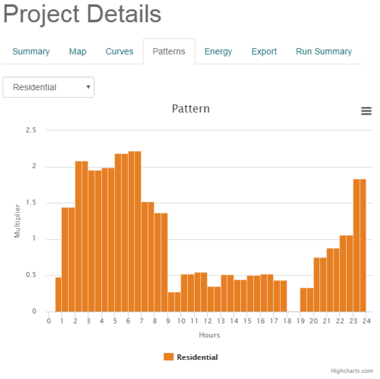
The Patterns tab will display a bar graph of water usage. The type of usage can be selected from the drop down list in the upper left portion of the tab. Clicking the [[File:Menu Icon.png|16 px]] icon in the upper right portion of the tab will bring up a menu with commands for printing the graph or downloading the graph as an image file. | The Patterns tab will display a bar graph of water usage. The type of usage can be selected from the drop-down list in the upper-left portion of the tab. Clicking the [[File:Menu Icon.png|16 px]] icon in the upper right portion of the tab will bring up a menu with commands for printing the graph or downloading the graph as an image file. | ||
[[File:CityWaterProjectPattern.png|thumb|none|380 px|Example of the Patterns tab on the Project Details page]] | [[File:CityWaterProjectPattern.png|thumb|none|380 px|Example of the Patterns tab on the Project Details page]] | ||
| Line 135: | Line 160: | ||
In the If section, you can select any feature that is part of the simulation. You can then specify the conditions that feature needs to reach to trigger the rule. The (And/Or) drop-down menu allows adding additional If statements. | In the If section, you can select any feature that is part of the simulation. You can then specify the conditions that feature needs to reach to trigger the rule. The (And/Or) drop-down menu allows adding additional If statements. | ||
In the | In the Then section, you can specify a pipe, pump, valve, or link that is changed by the met If condition. This is often changing the status of the feature. Multiple features can be used. | ||
The Else | The Else drop-down allows triggering changes to a pipe, pump, valve, or link when the If condition is not met. | ||
The Priority drop-down permits assigning an order value to the rule—a rule assigned a priority of 1 will trigger before a rule with a priority of 2 and so on. | The Priority drop-down permits assigning an order value to the rule— a rule assigned a priority of 1 will trigger before a rule with a priority of 2 and so on. | ||
===Creating or Editing Controls=== | ===Creating or Editing Controls=== | ||
| Line 171: | Line 196: | ||
==Export== | ==Export== | ||
The Export tab provides options | The Export tab provides options for exporting the project data as a shapefile. | ||
'''''Report Map Shapefile''''' | '''''Report Map Shapefile''''' | ||
| Line 185: | Line 210: | ||
[[File:CityWaterProjectExport.png|thumb|none|600 px|Example of the Export tab in the Project Details page]] | [[File:CityWaterProjectExport.png|thumb|none|600 px|Example of the Export tab in the Project Details page]] | ||
==Related Topics== | ==Related Topics== | ||
Latest revision as of 19:53, 20 May 2020
The Project Details contains a number of tabs which display data from the project files.
On the left side of the page are a few buttons.
- New Scenario – This button is only available for administrative accounts. It allows creating new scenarios for an existing project. After a project has scenarios generated, a drop-down menu listing all the scenarios becomes available. Selecting a scenario changes the rest of the Project Details page to reflect data from the selected scenario.
- Run – This button is only available for administrative accounts. This button becomes active when a change has been made for the selected scenario. The Run button then must be used in order for the Project Details page to reflect the changes.
- Edit – This button brings up the Edit Project page which is similar to the Create New Project page having the same options. This allows changing the project name, details, and other information that was entered when the project was created.
- Delete – This button removes the project.
Summary
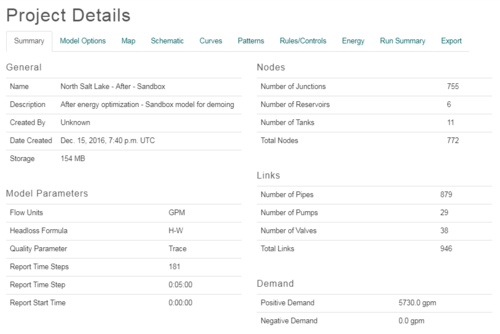
The Summary tab in the Project Details page displays information about the project.
General
- Name – The name of the project.
- Description – A description of the project.
- Created By – The username of the person who created the project.
- Date Created – The date on which the project was created.
- Storage – How much storage space the project files use.
Model Parameters
- Flow Units – The amount of water flowing from CityWater Pumps.
- Headloss Formula – Determining the discharge.
- Quality Parameter – Parameters for water quality measured in AGE.
- Report Time Steps – Number of time steps.
- Report Time Step – Time of report.
- Report Start Time – Start time of the report.
Nodes
- Number of Junctions – Total amount of junctions in the model.
- Number of Reservoirs – Total amount of reservoir in the model.
- Number of Tanks – Total number of tanks in the model.
- Total Nodes – Number of nodes in the model.
Links
- Number of Pipes – Total number of pipes in the model.
- Number of Pumps – Total number of pumps in the model.
- Number of Valves – Total number of valves in the model.
- Total Links
Demand
- Positive Demand – The positive coefficient expected for the given area.
- Negative Demand – The negative coefficient expected for the given area.
Changes
The Changes tab only appears for scenarios. Select a scenario to access this tab. The tab displays a list of differences between the base model and the scenario. Changes are organized in to changes to the global options, time options, nodes, or links. Changes to nodes and links will contain a hyperlink to jump to that particular link or node in the project map.
The following sections will be visible:
- Changed Global Options - A list of changes made to the Global Options
- Changed Nodes - A list of nodes that have changed and what the changes were
- Changed Time Options - A list of changes made to the Time Options
- Changed Links - A list of links that have changed and what the changes were
Model Options
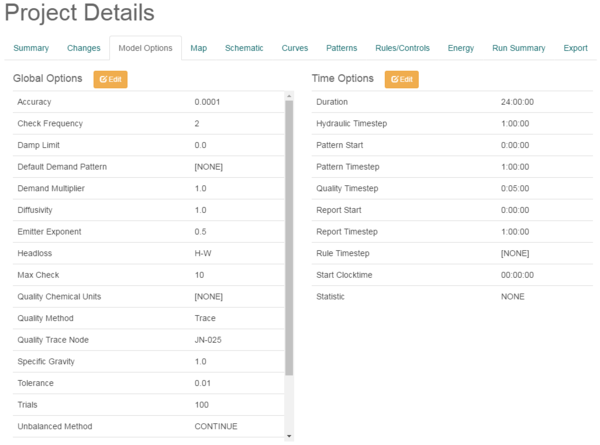
The Model Options tab allows viewing and changing parameters for the model run. For the base model, the options can only be viewed. For simulations, the options can be changed by clicking the Edit button.
Options are listed alphabetically and include the following:
Global Options
- Accuracy – The accuracy of the project.
- Check Frequency – The frequency of the check.
- Damp Limit – The allowed level of damp for the project.
- Default Demand Pattern – The default demand pattern assigned to the model.
- Demand Multiplier – Indicates by how much the maximum day demand should be multiplied.
- Diffusivity – The amount of diffusion admitted.
- Emitter Exponent – The measurement of the pressure and the discharge.
- Headloss – The amount of energy lost in the process.
- Max Check – The max check for the project.
- Pressure – Amount of pressure.
- Quality Chemical Units – Amount of quality chemical units found in the project.
- Quality Method – The quality method used for the project.
- Quality Trace Node –
- Specific Gravity – The gravity specified for the project area.
- Tolerance – The tolerance specified for the project.
- Trials – Trials run.
- Unbalanced Method – Active method.
- Unbalanced N – The amount of unbalanced force affecting the project.
- Units – The units used in the project.
- Viscosity – The viscosity of the water within the area.
Time Options
- Duration
- Hydraulic Timestep
- Pattern Start
- Pattern Timestep
- Quality Timestep
- Report Start
- Report Timestep
- Rule Timestep
- Start Clocktime
- Statistic
Map
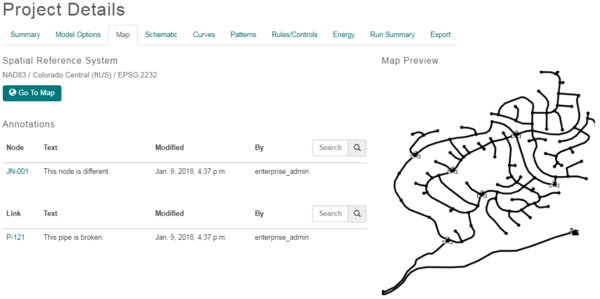
The Map tab displays information about the project map.
Spatial Reference System
This section displays the spatial reference system the project is using.
- Go To Map – This button will open the project map page.
Annotations
This section will show any notes or annotations added to the map.
- Nodes – Will show a list of annotations attached to nodes on the project map page.
- Text – Lists details regarding the node and the link.
- Modified – Lists details pertaining to the modifications made.
- By – Lists who contributed to the modifications.
- Links – Will show a list of annotations attached to links on the project map page.
Clicking on the node or link name will take you to the project map page with the node or link selected. The text of the annotation will be shown along with when the annotation was last modified and who modified it.
A search function is located next to each option to facilitate finding annotations for nodes and links. Enter the node or link name to view annotations for that element.
Map Preview
This section shows a scaled-down image of the pipe network in the project Map page.
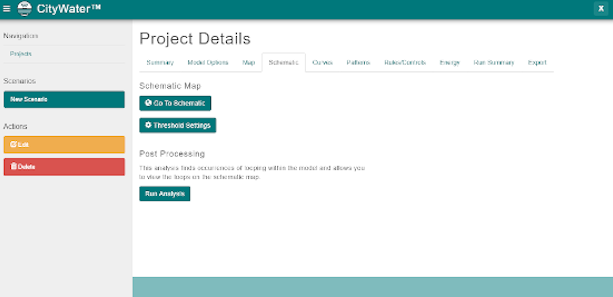
Schematic
Go To Schematic – This will open the schematic page to allow for the altering of the display of different attributes associated with the project.
Threshold Settings – This will open up the option to edit inefficiency thresholds.
- LEVEL THRESHOLD (gpm) – Use the arrow buttons, up and down, to choose the level threshold.
- LOADING THRESHOLD – Use the arrow buttons, up and down, to choose the loading threshold.
- EXCESSIVE PRESSURE THRESHOLD (psi) Use the arrow buttons, up and down, to choose the excessive pressure threshold.
Run Analysis – This option allows you to run and view the specs on the schematic map.
New Scenario – Select this to create a new scenario.
Edit – With this selection, you can edit project details.
Delete – With this selection, you can delete project details.
Curves
The Curves tab displays a curve graph for the selected pump. Select the pump curve to display from the drop-down menu in the upper-left portion of the tab. Clicking the ![]() icon in the upper right portion of the tab will bring up a menu with commands for printing the graph or downloading the graph as an image file.
icon in the upper right portion of the tab will bring up a menu with commands for printing the graph or downloading the graph as an image file.
Patterns
The Patterns tab will display a bar graph of water usage. The type of usage can be selected from the drop-down list in the upper-left portion of the tab. Clicking the ![]() icon in the upper right portion of the tab will bring up a menu with commands for printing the graph or downloading the graph as an image file.
icon in the upper right portion of the tab will bring up a menu with commands for printing the graph or downloading the graph as an image file.
Rules/Controls
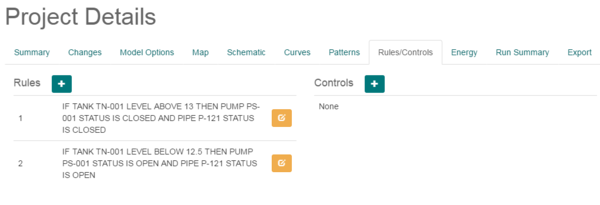
The Rules/Controls tab allows viewing, creating, and editing rules and controls applied to scenarios. With the base project, the rules and controls are only displayed and cannot be created or edited. After a scenario has been created, new rules or controls can be added by clicking the add ![]() button. Existing rules or controls for a scenario can be edited by clicking the edit
button. Existing rules or controls for a scenario can be edited by clicking the edit ![]() button.
button.
Creating or Editing Rules
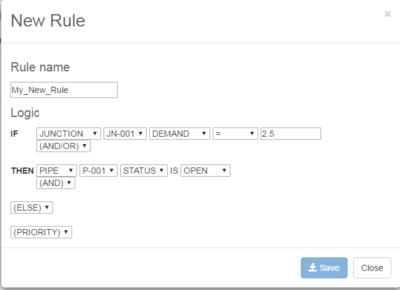
Rules are used with scenarios to give specific exceptions to how the model runs. Rules use if-then statements to determine how to alter the model run. When creating a new rule or editing an existing rule, the following window appears:
In the If section, you can select any feature that is part of the simulation. You can then specify the conditions that feature needs to reach to trigger the rule. The (And/Or) drop-down menu allows adding additional If statements.
In the Then section, you can specify a pipe, pump, valve, or link that is changed by the met If condition. This is often changing the status of the feature. Multiple features can be used.
The Else drop-down allows triggering changes to a pipe, pump, valve, or link when the If condition is not met.
The Priority drop-down permits assigning an order value to the rule— a rule assigned a priority of 1 will trigger before a rule with a priority of 2 and so on.
Creating or Editing Controls
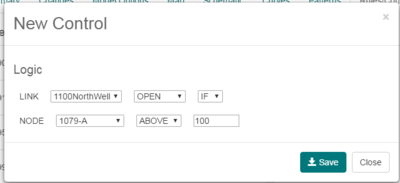
Controls allows changing the status of a link to Open or Close when a condition has been met at a node. When creating a new control or editing an existing control, the following window appears:
The Link section allows selecting a link and designating if the link is to open or close when a node reaches a certain value. The status change can be set to happen using an If or At statement.
The Node section allows selecting a node and designating the value which will trigger the Link status to change. The event trigger can be set to be Above or Below the entered value.
Energy
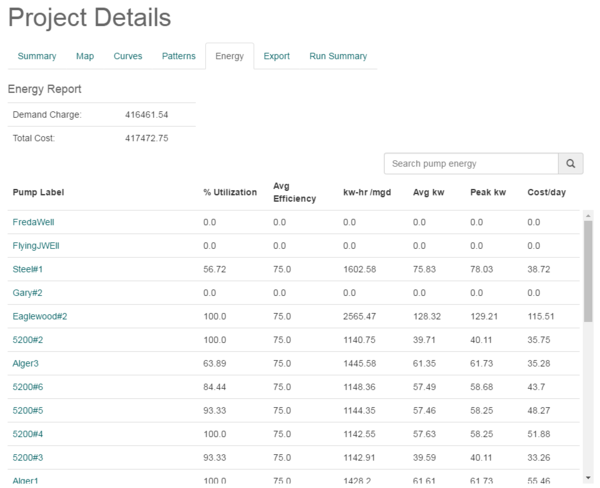
The Energy tab in the Project Details page contains a report of energy usage for each pump in the CityWater project.
Energy Report
- Demand Charge
- Total Cost
Energy Table
- Pump Label
- % Utilization
- Avg Efficiency
- kw-hr/mgd
- Avg kw
- Peak kw
- Cost/day
Run Summary
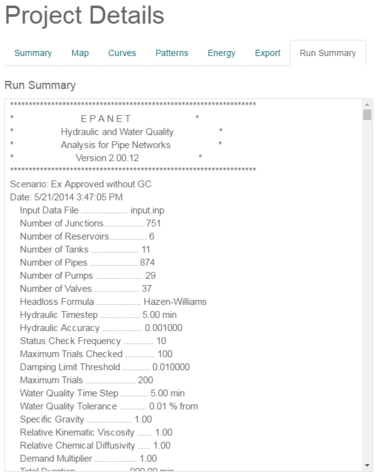
The Run Summary tab displays a file with a more complete analysis of the pipe network.
Export
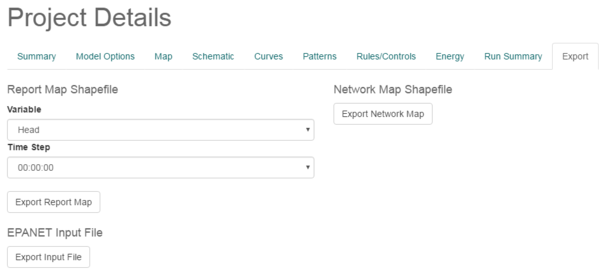
The Export tab provides options for exporting the project data as a shapefile.
Report Map Shapefile
- Variable
- Time Step
- Export Report Map
Network Map Shapefile
- Export Network Map
EPANET Input File
- Export Input File
Related Topics
CityWater | ||
|---|---|---|
| Articles: | Overview • Project Details • Project Map • Project Schematic • Scenarios • User Management |  |
| Support: | Tutorials • Convert NET File • What's New in CityWater • Release Notes • Terms and Conditions | |
| Aquaveo | ||
