HY8:Irregular Channel: Difference between revisions
No edit summary |
m (Jcreer moved page HY-8:Irregular Channel to HY8:Irregular Channel) |
||
| (7 intermediate revisions by the same user not shown) | |||
| Line 1: | Line 1: | ||
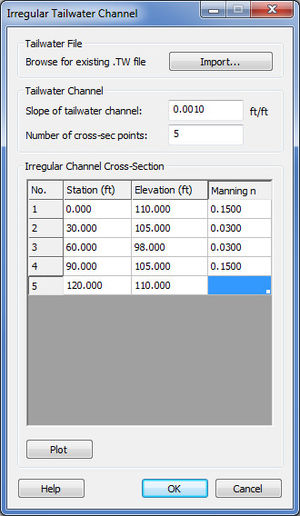
An irregular channel cross section option defines a channel using the channel slope and the station, elevation, and Manning's ''n'' at each input coordinate point. The number of coordinates allowed is unlimited, but using more coordinates will take longer to compute the results. All coordinates and n values may be copied from Microsoft Excel and pasted into the table. After all data have been entered, | An irregular channel cross section option defines a channel using the channel slope and the station, elevation, and Manning's ''n'' at each input coordinate point. The number of coordinates allowed is unlimited, but using more coordinates will take longer to compute the results. All coordinates and n values may be copied from Microsoft Excel and pasted into the table. After all data have been entered, plot and view the channel cross section looking downstream. | ||
[[Image:HY8image IrregularTailwaterChannel. | [[Image:HY8image IrregularTailwaterChannel.jpg|thumb|none|300 px|''Irregular Channel Tailwater'' Editor]] | ||
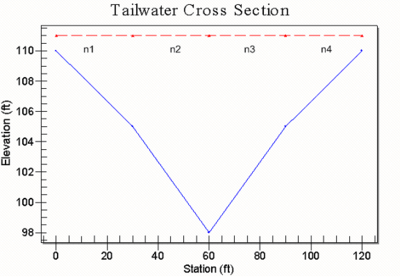
Manning's ''n'' is defined as shown in the figure below. An ''n'' value is assigned for each segment of the cross section beginning at the left (looking downstream) coordinate (below). If the ''n'' value is the same throughout the cross section, copy the ''n'' value by dragging the value from the first cell. | |||
[[Image: | [[Image:HY8image TailwaterCrossSection.png|400 px]] | ||
{{HY8Main}} | {{HY8Main}} | ||
[[Category:Crossing Data|I]] | [[Category:Crossing Data|I]] | ||
[[Category:HY-8 Dialogs]] | [[Category:HY-8 Dialogs|Irregular]] | ||
Latest revision as of 14:35, 4 October 2016
An irregular channel cross section option defines a channel using the channel slope and the station, elevation, and Manning's n at each input coordinate point. The number of coordinates allowed is unlimited, but using more coordinates will take longer to compute the results. All coordinates and n values may be copied from Microsoft Excel and pasted into the table. After all data have been entered, plot and view the channel cross section looking downstream.
Manning's n is defined as shown in the figure below. An n value is assigned for each segment of the cross section beginning at the left (looking downstream) coordinate (below). If the n value is the same throughout the cross section, copy the n value by dragging the value from the first cell.

