HY8:Getting Started: Difference between revisions
No edit summary |
No edit summary |
||
| (10 intermediate revisions by 2 users not shown) | |||
| Line 1: | Line 1: | ||
[[ | [[HY8:HY-8|HY-8]] automates culvert hydraulic computations creating a number of essential features that make culvert analysis and design easier. | ||
HY-8 enables users to analyze: | HY-8 enables users to analyze: | ||
*The performance of culverts | |||
*Multiple culvert barrels at a single crossing as well as multiple crossings | |||
*Roadway overtopping at the crossing and | |||
*Develop report documentation in the form of performance tables, graphs, and key information regarding the input variables | |||
[[ | [[HY8:Building a Project|New to HY-8 is the ability to define multiple crossings within a single project.]] A crossing is defined by 1 to 6 culverts, where each culvert may consist of multiple barrels. In previous versions this defined the entire project. However, with HY-8 any number of projects may be defined within the same project. The diagram below illustrates the hierarchy of a HY-8 project. | ||
[[Image:HY8image ProjectExplorer.jpg]] | :[[Image:HY8image ProjectExplorer.jpg]] | ||
Within a project new crossings can be created and then for each crossing up to six culverts can be defined. | Within a project new crossings can be created and then for each crossing up to six culverts can be defined. | ||
| Line 19: | Line 19: | ||
The '''Microsoft Virtual Map Locator''' tool has been included within HY-8 so that a roadway map or aerial photograph can be displayed and culvert crossing locations mapped as shown below. | The '''Microsoft Virtual Map Locator''' tool has been included within HY-8 so that a roadway map or aerial photograph can be displayed and culvert crossing locations mapped as shown below. | ||
:[[Image:HY8image VirtualMap.jpg|thumb|none|600 px|Roadmap downloaded from the Virtual Earth Map Locator]] | |||
[[Image:HY8image VirtualMap.jpg|thumb|none|600 px]] | |||
After defining the culvert properties, the analysis, including overtopping of the roadway, is completed and the performance output can be evaluated, graphed, and summarized in reports. A sample of the first output screen is shown below. | After defining the culvert properties, the analysis, including overtopping of the roadway, is completed and the performance output can be evaluated, graphed, and summarized in reports. A sample of the first output screen is shown below. | ||
:[[Image:HY8image SummaryOfFlows.jpg|thumb|none|600 px|First output screen]] | |||
[[Image:HY8image SummaryOfFlows.jpg|thumb|none|600 px]] | |||
| Line 33: | Line 30: | ||
{{HY8Main}} | {{HY8Main}} | ||
[[Category:HY-8 General Information|G]] | [[Category:HY-8 General Information|G]] | ||
[[Category:HY-8 Dialogs]] | [[Category:HY-8 Dialogs|get]] | ||
Latest revision as of 15:09, 2 July 2018
HY-8 automates culvert hydraulic computations creating a number of essential features that make culvert analysis and design easier.
HY-8 enables users to analyze:
- The performance of culverts
- Multiple culvert barrels at a single crossing as well as multiple crossings
- Roadway overtopping at the crossing and
- Develop report documentation in the form of performance tables, graphs, and key information regarding the input variables
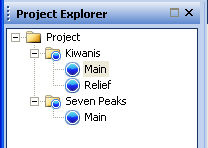
New to HY-8 is the ability to define multiple crossings within a single project. A crossing is defined by 1 to 6 culverts, where each culvert may consist of multiple barrels. In previous versions this defined the entire project. However, with HY-8 any number of projects may be defined within the same project. The diagram below illustrates the hierarchy of a HY-8 project.
Within a project new crossings can be created and then for each crossing up to six culverts can be defined.
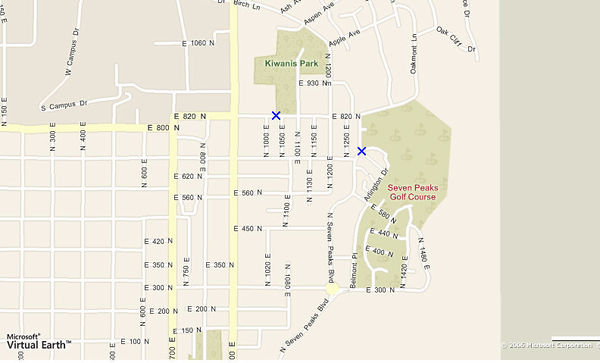
The Microsoft Virtual Map Locator tool has been included within HY-8 so that a roadway map or aerial photograph can be displayed and culvert crossing locations mapped as shown below.
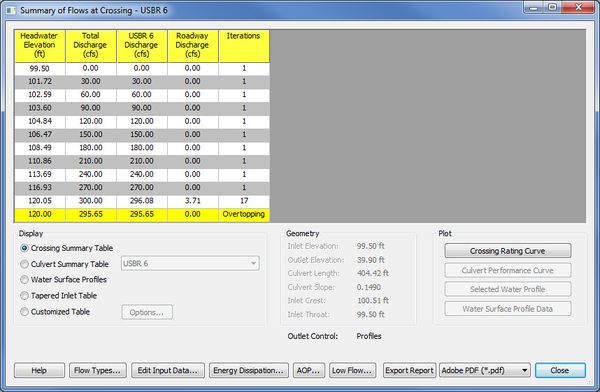
After defining the culvert properties, the analysis, including overtopping of the roadway, is completed and the performance output can be evaluated, graphed, and summarized in reports. A sample of the first output screen is shown below.
This is the general work flow of a HY-8 project. The rest of this help file document provides more detailed information about data input, analysis, and reporting.


