CW:CityWater Project Details: Difference between revisions
(→Export) |
(→Export) |
||
| Line 98: | Line 98: | ||
*Export Network Map | *Export Network Map | ||
''''EPANET Input File''''' | '''''EPANET Input File''''' | ||
* Export Input File | * Export Input File | ||
Revision as of 19:14, 18 May 2017
The Project Details contains a number of tabs which display data from the project files.
On the left side of the page are two buttons.
- Edit – This button brings up the Edit Project page which is similar to the Create New Project page having the same options. This allows changing the project name, details, and other information that was entered when the project was created.
- Delete – This button removes the project.
Summary
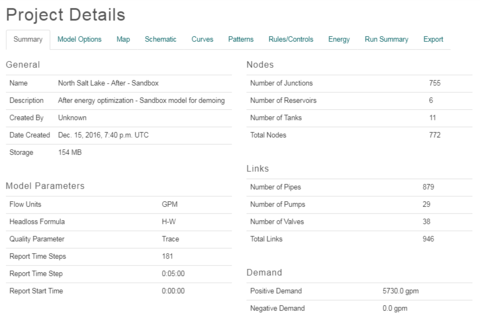
The Summary tab in the Project Details page displays information about the project.
General
- Project Name
- Description
- Date Created
Model Parameters
- Flow Units
- Headloss Formula
- Quality Parameter
- Report Time Steps
- Report Time Step
- Report Start Time
Nodes
- Number of Junctions
- Number of Reservoirs
- Number of Tanks
- Total Nodes
Links
- Number of Pipes
- Number of Pumps
- Number of Valves
- Total Links
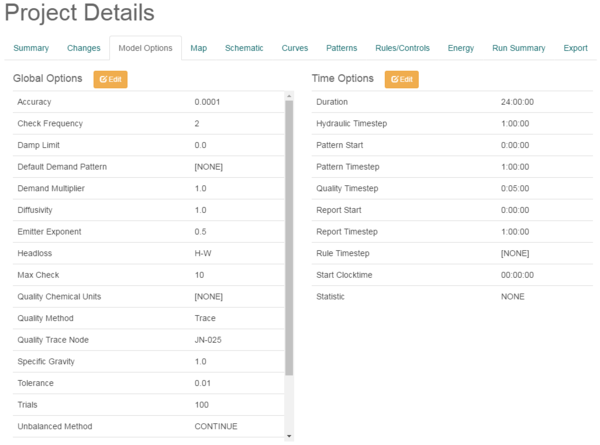
Model Options
Map
The Map tab displays information about the project map.
Spatial Reference System
This section displays the spatial reference system the project is using.
- Go To Map – This button will open the project Map page.
Annotations
This section will show any notes or annotations added to the map.
- Nodes – Will show a list of annotations attached to nodes on the project map page.
- Links – Will show a list of annotations attached to links on the project map page.
A search function is located next to each option to facilitate finding annotations for nodes and links. Enter the node or link name to view annotations for that element.
Map Preview
This section shows a scaled down image of the pipe network in the project Map page.
Curves
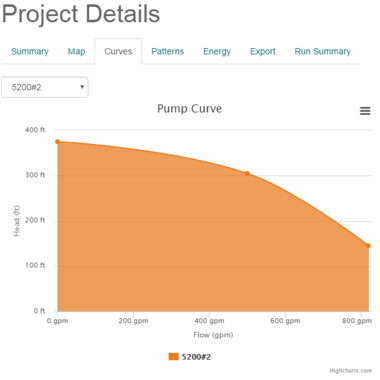
The Curves tab displays a curve graph for the selected pump. Select the pump curve to display from the drop down menu in upper left portion of the tab. Clicking the ![]() icon in the upper right portion of the tab will bring up a menu with commands for printing the graph or downloading the graph as an image file.
icon in the upper right portion of the tab will bring up a menu with commands for printing the graph or downloading the graph as an image file.
Patterns
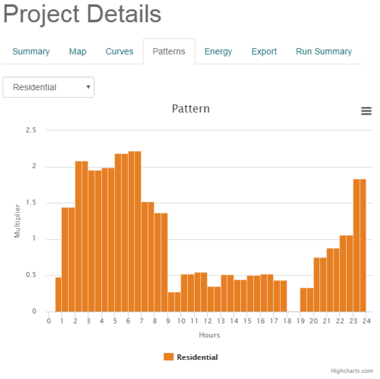
The Patterns tab will display a bar graph of water usage. The type of usage can be selected from the drop down list in the upper left portion of the tab. Clicking the ![]() icon in the upper right portion of the tab will bring up a menu with commands for printing the graph or downloading the graph as an image file.
icon in the upper right portion of the tab will bring up a menu with commands for printing the graph or downloading the graph as an image file.
Rules/Controls
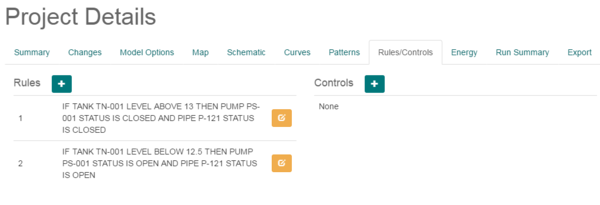
The Rules/Controls tab allows viewing, creating, and editing rules and controls applied to scenarios. With the base project, the rules and controls are only displayed and cannot be created or edited. After a scenario has been created, new rules or controls can be added by clicking the add button. Existing rules or controls for a scenario can be edited by clicking the edit button.
Energy
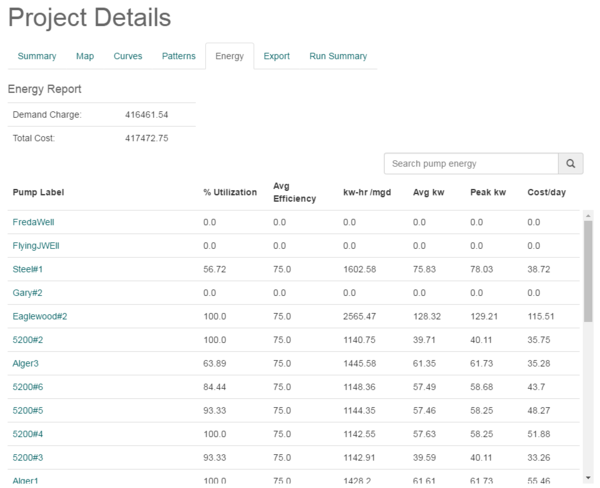
The Energy tab in the Project Details page contains a report of energy usage for each pump in the CityWater project.
Energy Report
- Demand Charge
- Total Cost
Energy Table
- Pump Label
- % Utilization
- Avg Efficiency
- kw-hr/mgd
- Avg kw
- Peak kw
- Cost/day
Export
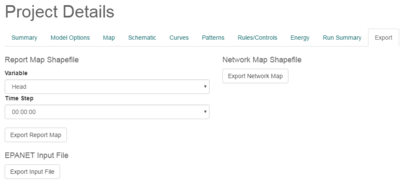
The Export tab provides options of exporting the project data as a shapefile.
Report Map Shapefile
- Variable
- Time Step
- Export Report Map
Network Map Shapefile
- Export Network Map
EPANET Input File
- Export Input File
Run Summary
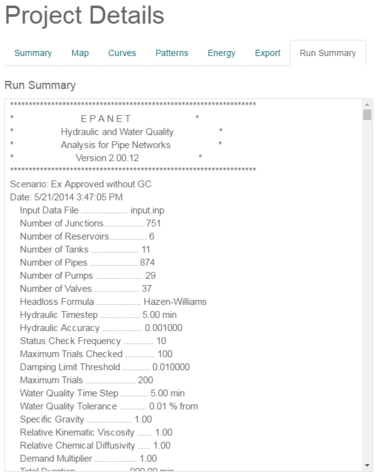
The Run Summary tab displays a file with a more complete analysis of the pipe network.
Related Topics
CityWater | ||
|---|---|---|
| Articles: | Overview • Project Details • Project Map • Project Schematic • Scenarios • User Management |  |
| Support: | Tutorials • Convert NET File • What's New in CityWater • Release Notes • Terms and Conditions | |
| Aquaveo | ||
