Template:Check/Fix Levee Ground Elevations: Difference between revisions
No edit summary |
No edit summary |
||
| Line 50: | Line 50: | ||
*ADCIRC|Check/Fix Levee Crest Elevations | *ADCIRC|Check/Fix Levee Crest Elevations | ||
<noinclude>[[Category: | <noinclude>[[Category:Toolbox]]</noinclude> | ||
Revision as of 20:30, 20 October 2023
Check/Fix Levee Ground Elevations
The Check/Fix Levee Ground Elevations tool checks and lowers, if needed, the elevations of an ADCIRC domain based on the crest elevations defined in an ADCIRC Boundary Conditions coverage. ADCIRC requires that the ground elevation specified for the nodes on either side of a levee structure be lower than the crest elevation of the levee. Failure to meet this condition results in a model run failure. This tool creates a new dataset that can be mapped as the elevation for the 2D mesh to ensure compliance with the levee crest requirement.
Input Parameters
- Input ADCIRC Boundary Conditions coverage – Coverage containing the arcs which represent the levees to be checked. A pair of arcs are associated with a levee crest curve.
- Note: When an ADCIRC simulation is loaded from model native files a set of mapped boundary conditions is created on the simulation. This must be converted to a coverage (right-click on the mapped boundary condition object) to create the arcs that are used in this tool.
- Domain Grid – The 2DMesh of the ADCIRC domain. (Note: The tool will actually work with a UGrid or a 2DMesh. ADCIRC simulations currently take 2DMesh objects.)
- Minimum height of crest elevation above ground – This is the user specified minimum difference between the crest elevation defined in the ADCIRC BC file and the mesh elevation. Strictly speaking, this just needs to be a positive value.
Output Parameters
- Output dataset – The name to assign the output dataset which can be mapped as the mesh elevation to comply with ADCIRC elevation requirement.
- Output difference dataset – The name to assign the output dataset which can be displayed to visualize the difference imposed by the tool.
Operation
The tool performs a check on each selected levee arc or all levee arcs in the coverage if there are no selected arcs. For each levee arc pair the tool does the following:
- Maps or snaps the levee arcs to the 2D mesh to get the levee node pairs.
- Extracts the elevations for both nodes in the node pair.
- Extracts the defined crest elevation for each node pair.
- Adjusts the elevation for either node in the pair (or both if they are both invalid) whose elevation is not below the defined crest elevation by the specified minimum difference.
- Performs validity checks for the levee.
- Invalid levee definition: Ensures that the levee definition is valid with the selected 2D mesh. This is based on the mapping operation. A level is invalid if it does not line up with a "hole" in the mesh for that levee or if the number of nodes on opposite sides of that hole is not consistent. Invalid levees are not deleted from the boundary condition file. They are left unchanged (i.e. the crest elevations of the invalid levee will be the same as in the input Boundary Conditions coverage.) If this check fails, no other checks are performed.
- Node(s) in multiple levees: Checks for the usage of any node in the levee in another levee. If a mesh node appears in more than one levee definition after snapping the input levee boundaries to the domain mesh, this global warning will be reported. While this is a legal and common condition, the behavior of ADCIRC at these nodes is not well defined.
If the user chooses to accept the adjustments, the two output datasets will be loaded onto the input domain mesh in SMS. The user may then use the Data → Map Elevation… command to set the adjusted elevation dataset as the Z dataset of the mesh. (Note: if no adjustments were made, no datasets will be created.)
Reviewing Results
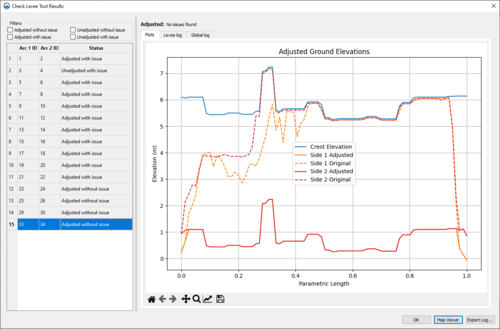
After the checks are complete a plot/results window appears if there were any adjustments made. The report window contains a table where each row represents a levee pair. In a pane to the right of the table, a plot is displayed for the currently selected levee. The x-axis is parametric distance along the arc and the y-axis is elevation. Curves are drawn for the levee crest elevation (as defined in the BC coverage) and the geometry from the mesh on either side of the levee both before and after adjustment. Adjusted elevations are plotted as solid lines while original elevations are plotted as dashed lines.
The levees shown in the table and drawn in the map viewer can be filtered based on the four possible check statuses. The check status and a short description of the detected issues is displayed in a label on the right side pane.
- Adjusted: Nodes (s) in multiple levees, gaps in check line or incomplete check line.
- Adjusted without issue: Indicates that the crest elevations for the levee did need adjusting but no other issues were detected.
- Adjusted with issue: Indicates that the crest elevations for the levee did need adjusting and one or more other issues were detected. See the “Validity checks” section for the possible issues that may be detected.
- Unadjusted without issue: Indicates that the crest elevations for the levee did not need adjusting and no other issues were detected.
- Unadjusted with issue: Indicates that the crest elevations for the levee were not adjusted but one or more other issues were detected. See the “Validity checks” section for the possible issues that may be detected.
Clicking the OK button closes both results dialog and returns the user to the tool runner dialog where they can either click OK to accept the adjustments and create the new Boundary Conditions coverage in SMS or Cancel to reject the adjustments.
Clicking the Map Viewer button will bring the map viewer dialog to the front as it is a modeless dialog that can be hidden.
Clicking the Export Log... button will prompt the user for filename and write the global and levee-specific logs to the selected file.
Map Viewer
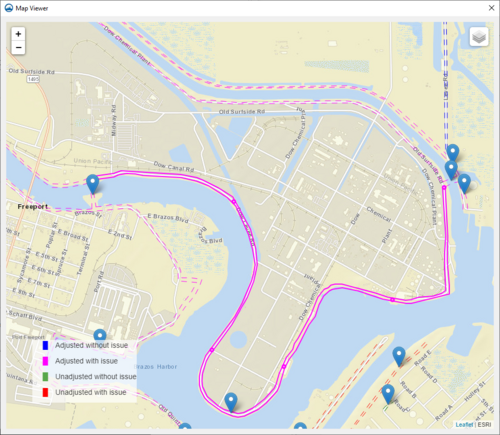
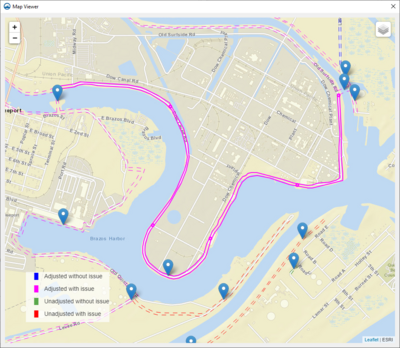
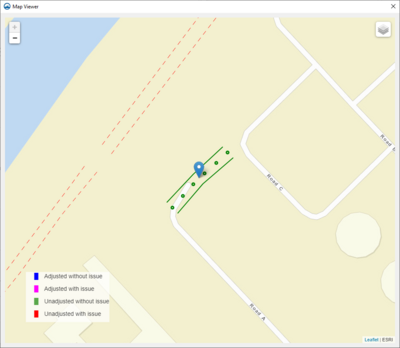
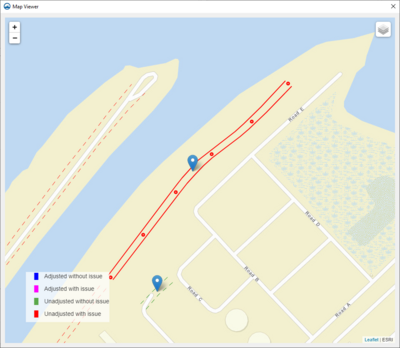
The Map Viewer contains a map view of all the levee arcs currently being displayed in the levee results table. The currently selected levee pair in the levee results table is drawn with solid lines in the map viewer and all other levees are drawn with dashed lines. Point markers are drawn in the middle of the levee at 20% intervals that match the parametric length ticks on the x-axis of the levee result plot.
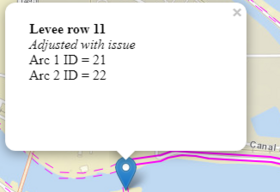
A marker is displayed in the middle of each levee that displays a short description of the levee pair when clicked on.
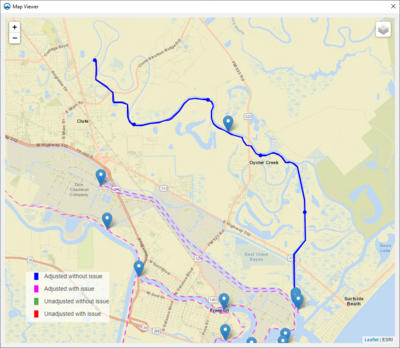
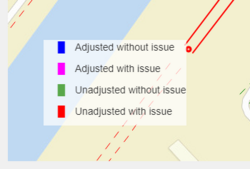
The color of the levee arcs is determined by check status.
- Adjusted without issue: Blue
- Adjusted with issue: Magenta
- Unadjusted without issue: Green
- Unadjusted with issue: Red
The zoom level can be manually adjusted with the control in the top left of the dialog.
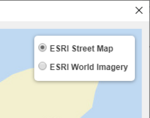
The layer control in the top right of the dialog can be used to switch between the “ESRI Street Map” and “ESRI World Imagery” background map layers.
The bottom left corner of the dialog contains a legend for the possible levee check status colors.
Current Location in Toolbox
ADCIRC|Check/Fix Levee Ground Elevations
Related Tools
- ADCIRC|Check/Fix Levee Crest Elevations
