XY Series Editor: Difference between revisions
No edit summary |
No edit summary |
||
| Line 2: | Line 2: | ||
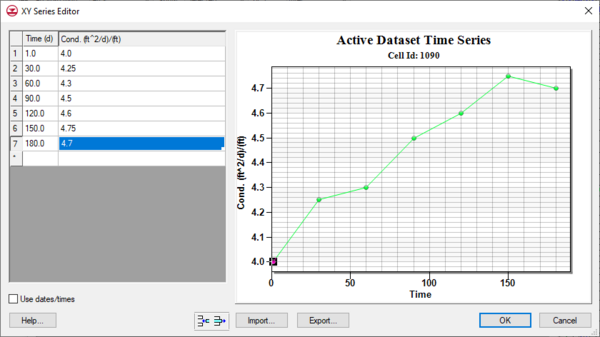
The ''XY Series Editor'' is a special dialog that is used to generate and edit curves defined by a list of x and y coordinates. The curve can be created and edited by directly editing the xy coordinates using a spreadsheet list of the coordinates. An entire list of curves can be generated and edited with the editor and curves can be imported from and exported to text files for future use. It is also possible to paste xy data directly to the spreadsheet. | The ''XY Series Editor'' is a special dialog that is used to generate and edit curves defined by a list of x and y coordinates. The curve can be created and edited by directly editing the xy coordinates using a spreadsheet list of the coordinates. An entire list of curves can be generated and edited with the editor and curves can be imported from and exported to text files for future use. It is also possible to paste xy data directly to the spreadsheet. | ||
The ''XY Series Editor'' is used in GMS, SMS, and WMS. It was designed to be general in nature so that it could be used anywhere that a curve or function needs to be defined. In some cases, the x values of the curve must correspond to a | The ''XY Series Editor'' is used in GMS, SMS, and WMS. It was designed to be general in nature so that it could be used anywhere that a curve or function needs to be defined. In some cases, the x values of the curve must correspond to a predefined set of values. For example, the x values may correspond to a set of time steps whose interval is established in a separate dialog. In such cases, the x fields cannot be edited but the y values associated with the predefined x values can be edited. In other cases, there is no limit on the number of x values or on the x spacing and both the x and y values can be edited. | ||
===The XY Edit Fields=== | ===The XY Edit Fields=== | ||
Revision as of 22:36, 20 September 2022
The XY Series Editor is a special dialog that is used to generate and edit curves defined by a list of x and y coordinates. The curve can be created and edited by directly editing the xy coordinates using a spreadsheet list of the coordinates. An entire list of curves can be generated and edited with the editor and curves can be imported from and exported to text files for future use. It is also possible to paste xy data directly to the spreadsheet.
The XY Series Editor is used in GMS, SMS, and WMS. It was designed to be general in nature so that it could be used anywhere that a curve or function needs to be defined. In some cases, the x values of the curve must correspond to a predefined set of values. For example, the x values may correspond to a set of time steps whose interval is established in a separate dialog. In such cases, the x fields cannot be edited but the y values associated with the predefined x values can be edited. In other cases, there is no limit on the number of x values or on the x spacing and both the x and y values can be edited.
The XY Edit Fields
The two vertical columns of edit fields on the left side of the dialog are for direct editing of the xy series values. A pair of application-specific titles appears at the top of the columns.
The buttons below the xy edit fields are used to manipulate the values in the edit fields. Some of the buttons are application-specific. The buttons are as follows:
- Use dates/times
- For selected situations such as entering time series data in the Map module, it is useful to enter the data in date/time format. Checking this option allows the x values in the curve to be entered in date/time format.
- Insert Row

- Inserts a row between the active row and the row just above it. Interpolates the data from the two rows to create the data for the new row.
- Delete Row

- Deletes the active row.
- Import/Export Buttons
- The Import and Export buttons allow reading in or saving an xy series file.
The XY Series Plot
The window on the right side of the XY Series Editor is used to plot the curve corresponding to the xy values in the edit fields. As each value in the edit fields is edited, the corresponding point on the curve is adjusted instantaneously. Plot options are accessed by right-clicking on the plot.
