WMS:Quick Tour -Post Processing: Difference between revisions
From XMS Wiki
Jump to navigationJump to search
No edit summary |
No edit summary |
||
| Line 10: | Line 10: | ||
[[WMS:Quick Tour -Computing Composite Curve Numbers| '''< Previous''']] | [[WMS:Quick Tour - Post Processing| ''' Next >''']] | [[WMS:Quick Tour -Computing Composite Curve Numbers| '''< Previous''']] | [[WMS:Quick Tour - Post Processing| ''' Next >''']] | ||
[[Category:WMS Quick Tour| | [[Category:WMS Quick Tour|Post]] | ||
Revision as of 16:47, 6 January 2017
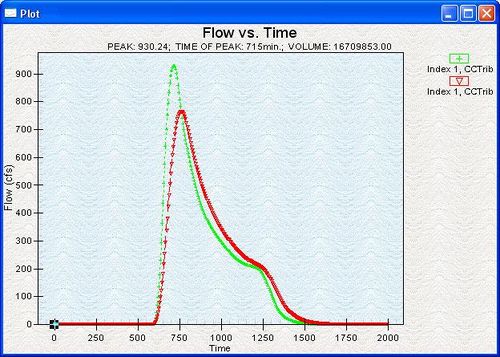
All of the hydrologic interfaces supported by WMS produce hydrographs or peak flow data that can be graphed in WMS. The flow data can be viewed in plot windows. In addition to zooming in on and resizing plot windows, users can modify plot display options
Hydrographs and other data can also be exported for use in standard spreadsheet software.
