HY8:Culvert Summary: Difference between revisions
From XMS Wiki
Jump to navigationJump to search
No edit summary |
No edit summary |
||
| Line 16: | Line 16: | ||
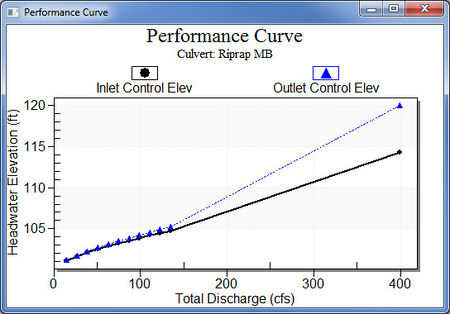
In the table, bold values indicate inlet or outlet controlling depths. Within the culvert summary option, plot the performance curve for each culvert in the crossing. A sample performance curve is displayed in the figure below. | In the table, bold values indicate inlet or outlet controlling depths. Within the culvert summary option, plot the performance curve for each culvert in the crossing. A sample performance curve is displayed in the figure below. | ||
[[Image:HY8image45.jpg|450 px]] | |||
[[Image:HY8image45.jpg]] | |||
Revision as of 15:53, 14 June 2016
The culvert summary table shows the performance table for each culvert in the crossing. Each culvert's properties can be viewed by selecting the desired culvert from the drop-down list. The following properties are represented in the table:
- Total Discharge: Total discharge at the culvert crossing
- Culvert Discharge: Amount of discharge that passes through the selected culvert barrel(s)
- Headwater Elevation: Computed headwater elevation at the inlet of the culvert(s)
- Inlet Control Depth: Inlet control headwater depth above inlet invert
- Outlet Control Depth: Outlet control headwater depth above inlet invert
- Flow Type: USGS flow type 1 through 7 is indicated and the associated profile shape and boundary condition. Press the Flow Types button for a summary of Flow Types.
- Normal Depth: Normal depth in the culvert. If the culvert capacity is insufficient to convey flow at normal depth, normal depth is set equal to the barrel height.
- Critical Depth: Critical depth in culvert. If the culvert capacity is insufficient to convey flow at critical depth, critical depth is set equal to the barrel height.
- Outlet Depth: Depth at culvert outlet
- Tailwater Depth:Depth in downstream channel
- Outlet Velocity: Velocity at the culvert outlet
- Tailwater Velocity:Velocity in downstream channel
In the table, bold values indicate inlet or outlet controlling depths. Within the culvert summary option, plot the performance curve for each culvert in the crossing. A sample performance curve is displayed in the figure below.
