CW:CityWater Project Schematic: Difference between revisions
(→Sizing) |
(→Sizing) |
||
| Line 45: | Line 45: | ||
===Sizing=== | ===Sizing=== | ||
The sizing display options allow you to adjust the size of the nodes on the Conceptual Schematic by type or by value. The default is to display by type, emphasizing the Tanks, Reservoirs, and Demand Zones. All options in this tab include: | The sizing display options allow you to adjust the size of the nodes on the Conceptual Schematic by type or by value. The default is to display by type, emphasizing the Tanks, Reservoirs, and Demand Zones. All options in this tab include: | ||
*''By Type'' | *''By Type'' | ||
Revision as of 19:45, 18 May 2020
Accounts with the Pressure Zone Schematic Add-on allow viewing project schematics.
Conceptual Zone Layers
The Professional and Enterprise editions of CityWater include the conceptual approach to understanding the water distribution model. Using proprietary algorithms, the model is automatically delineated into conceptual zone, roughly equivalent to pressure zones.
There are two major types of conceptual zones: hydraulic zones and boundary zones. The hydraulic zones consists of at least one node, but often are composed of many nodes and links that are hydraulically connected (i.e.: no boundaries made up of valves or pumps to separate them). Boundary zones consist of one or more pumps, valves, or closed pipes that separate the hydraulic zones. In the Professional and Enterprise editions of CityWater, two additional layers are provided on the map for visualizing the conceptual zones.
The naming of zones is done automatically on the Legend with the following convention:
- Hydraulic zones are named with an “N”
- Boundary zones are named with an “L”
Conceptual Schematic
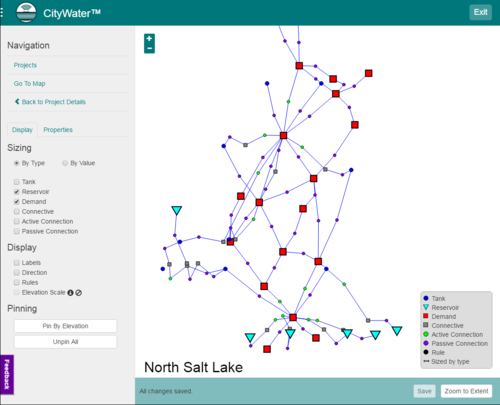
The Conceptual Schematic provides a simplified visualization of the conceptual zones and provides a high level overview of the most important elements in the model. The Conceptual Schematic is an interactive network diagram. The various nodes on the network represent conceptual elements of the model, including both the hydraulic zones and the boundary zones. The links between the nodes represent the relationships between each zone.
Schematic Legend
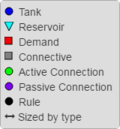
Use the legend at the right to decipher the type of each node.
Hydraulic Zones on the Schematic
The hydraulic zones are divided into two categories:
- Demand Hydraulic Zones (red squares) – Hydraulic zones where demand is applied in the model.
- Connective Hydraulic Zones (gray squares) – Have no demand applied and are essentially pass-through nodes and links.
Each tank and reservoir in the model is also represented as individual nodes on the conceptual schematic.
Boundary Zones on the Schematic
The boundary zones are also divided into two categories:
- Active Connection Boundary Zones (green circles) – Have at least one pump in them, indicating that they add energy to the system.
- Passive Connection Boundary Zones (purple circles) – Have no pumps and usually consist of a valves or closed pipes.
Notice that there is always a boundary zone between any of the tanks, reservoirs, or hydraulic zones.
Schematic Display Options
The Conceptual Schematic provides several display options to aid developing a quick understanding of the distribution system represented by the model. The display options are grouped into the following categories: Sizing, Display, and Pinning.
Sizing
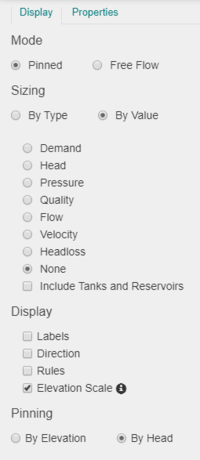
The sizing display options allow you to adjust the size of the nodes on the Conceptual Schematic by type or by value. The default is to display by type, emphasizing the Tanks, Reservoirs, and Demand Zones. All options in this tab include:
- By Type
- Tank
- Reservoir
- Demand
- Connective
- Active Connection
- Passive Connection
- By Value
- Demand
- Head
- Pressure
- Quality
- Flow
- Velocity
- Headloss
- None
- Include Tanks and Reservoirs
- Activate the Display tab by clicking on it in the left-hand menu.
- Change the types of nodes that are emphasized using size by checking the appropriate boxes on or off.
- Size the nodes by model values selecting the By Value radio option and then selecting the desired value.
In some comparisons, the tanks and reservoirs tend to skew the display, so they are not included by default. To include the tanks and reservoirs, check the box next to the Include Tanks and Reservoirs control.
Display
These display options allow you to display labels on each node in the Conceptual Schematic, the flow direction indicators, the rule nodes, and the elevation scale if pinned by elevation. These options are all off by default to prevent the schematic from becoming too cluttered.
- Activate the Display tab by clicking on it in the left-hand menu.
- Turn on the labels by selecting the checkbox next to the Labels display option. Tanks and Reservoirs are named according to the element name in the model. The hydraulic and boundary zones are named using the “N” and “L” naming convention. This convention is not very intuitive, however, you can customize the labels to a more easily understood name.
- Select one of the Demand Zones, red box.
- Click on the Edit button next to the zone label property.
- Enter the desired name in the dialog that appears and press Save. The label updates on the schematic and will be saved the next time you access it.
Pinning
The schematic uses a repelling force at each node to automatically sort itself out by default. While this is convenient, it also means the diagram will rarely be generated with the same orientation twice. Fortunately, the Conceptual Schematic allows you to pin nodes and save the pinned locations. This allows you to orient the schematic to your liking.
- While holding the left CTRL button on the keyboard, left-click and drag any of the nodes on the schematic.
- Release the mouse button when you have moved the node to the desired location.
- Repeat this process on three more of the schematic nodes so that you have four pinned nodes total.
- Notice that the footer of the Conceptual Schematic page displays a status message: “You have unsaved changes…” and refers to the pinned node positions. If you wait long enough, the changes will be saved automatically. You can also press the Save button in the footer to save the changes.
- Press the Save button to save all changes then refresh the page. Notice that the pinned nodes remain pinned when the schematic is regenerated and the rest of the nodes in the schematic automatically sort themselves based on the pinned nodes.
- Unpin any pinned node by holding the CTRL button and left-clicking on it with the mouse.
- Clear all the pinned nodes by activating the Display tab in the left-hand menu.
- Click on the Unpin All button. This restores the behavior of the schematic to its default state.
- Press the Save button to save the changes.
Another useful pinning option is to pin some of the nodes in the schematic by their average elevation:
- Activate the Display tab by clicking on it in the left hand menu.
- Press the Pin By Elevation button.
- Press the Save button to save the changes.
- Turn on the display of the elevation scale by checking the box to the left of the Elevation Scale control.
Only the Demand Hydraulic Zones, Connective Hydraulic Zones, Tanks, and Reservoir nodes are affected. The vertical ordinate of these nodes is adjusted such that the vertical positioning of the nodes is relative to their average elevations. The horizontal positioning is unaffected. If you find some nodes are overlapping after pinning by elevation, you can drag them apart horizontally and press the Pin By Elevations button again to reset the vertical pinning.
Related Topics
CityWater | ||
|---|---|---|
| Articles: | Overview • Project Details • Project Map • Project Schematic • Scenarios • User Management |  |
| Support: | Tutorials • Convert NET File • What's New in CityWater • Release Notes • Terms and Conditions | |
| Aquaveo | ||


