Template:ADCIRC Map Viewer
Map Viewer
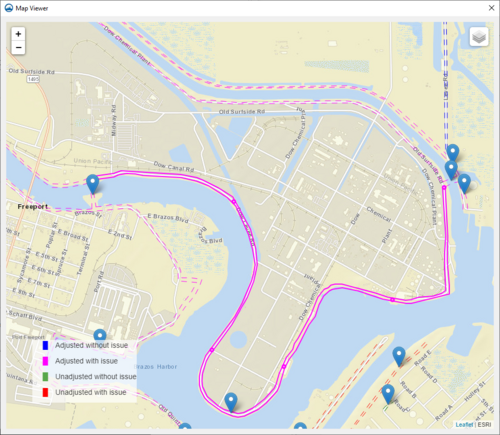
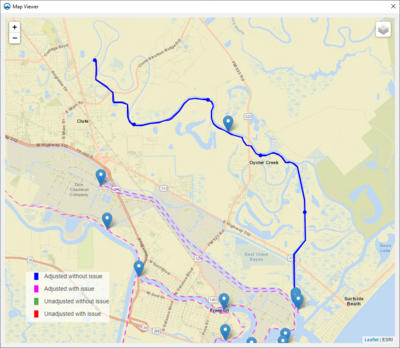
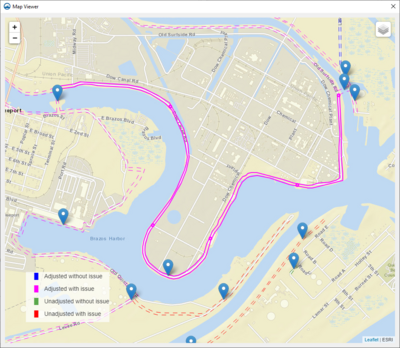
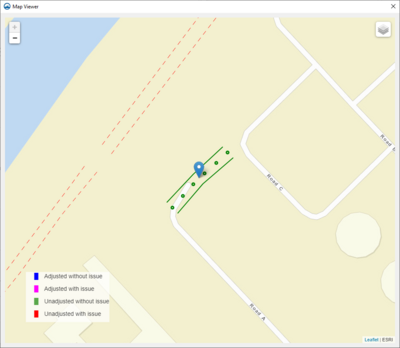
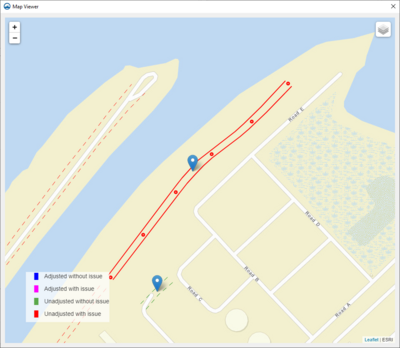
The Map Viewer contains a map view of all the levee arcs currently being displayed in the levee results table. The currently selected levee pair in the levee results table is drawn with solid lines in the map viewer and all other levees are drawn with dashed lines. Point markers are drawn in the middle of the levee at 20% intervals that match the parametric length ticks on the x-axis of the levee result plot.
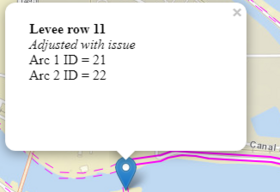
A marker is displayed in the middle of each levee that displays a short description of the levee pair when clicked on.
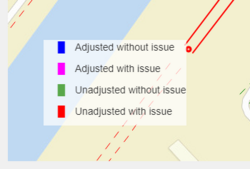
The color of the levee arcs is determined by check status.
- Adjusted without issue: Blue
- Adjusted with issue: Magenta
- Unadjusted without issue: Green
- Unadjusted with issue: Red
The zoom level can be manually adjusted with the control in the top left of the dialog.
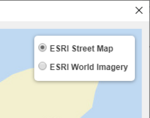
The layer control in the top right of the dialog can be used to switch between the “ESRI Street Map” and “ESRI World Imagery” background map layers.
The bottom left corner of the dialog contains a legend for the possible levee check status colors.
