File:StatAnalysis.png
From XMS Wiki
Jump to navigationJump to search

Size of this preview: 800 × 547 pixels. Other resolution: 930 × 636 pixels.
Original file (930 × 636 pixels, file size: 128 KB, MIME type: image/png)
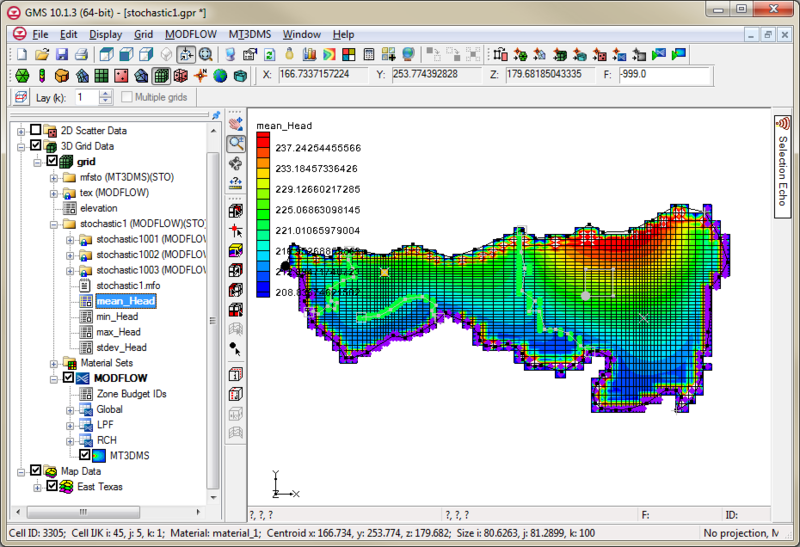
A statistical analysis can be computed on a Stochastic MODFLOW or MT3D solution by right-clicking on a stochastic folder in the Project Explorer and selecting the Statistical Analysis command. This command creates four datasets for the mean, min, max, and standard deviation. The 3D grid display options can then be used to visualize these datasets.
File history
Click on a date/time to view the file as it appeared at that time.
| Date/Time | Thumbnail | Dimensions | User | Comment | |
|---|---|---|---|---|---|
| current | ★ Approved revision 15:59, 20 July 2016 |  | 930 × 636 (128 KB) | Jcreer (talk | contribs) | |
| 15:44, 20 July 2016 |  | 930 × 636 (113 KB) | Jcreer (talk | contribs) | ||
| 20:17, 6 June 2007 |  | 854 × 569 (42 KB) | Kwinters (talk | contribs) |
You cannot overwrite this file.
File usage
The following page uses this file: