File:CEQUALW2BathymetryFig10.png: Difference between revisions
From XMS Wiki
Jump to navigationJump to search
No edit summary |
No edit summary |
||
| (One intermediate revision by the same user not shown) | |||
| Line 1: | Line 1: | ||
[[Category:CE-QUAL-W2]] | [[Category:CE-QUAL-W2]] | ||
[[Category:WMS Plot]] | |||
This curve is then compared against the storage capacity curve for East Canyon developed from original surveys performed during the design and construction of the reservoir. | |||
Latest revision as of 15:58, 26 October 2017
This curve is then compared against the storage capacity curve for East Canyon developed from original surveys performed during the design and construction of the reservoir.
File history
Click on a date/time to view the file as it appeared at that time.
| Date/Time | Thumbnail | Dimensions | User | Comment | |
|---|---|---|---|---|---|
| current | ★ Approved revision 00:56, 20 March 2013 | 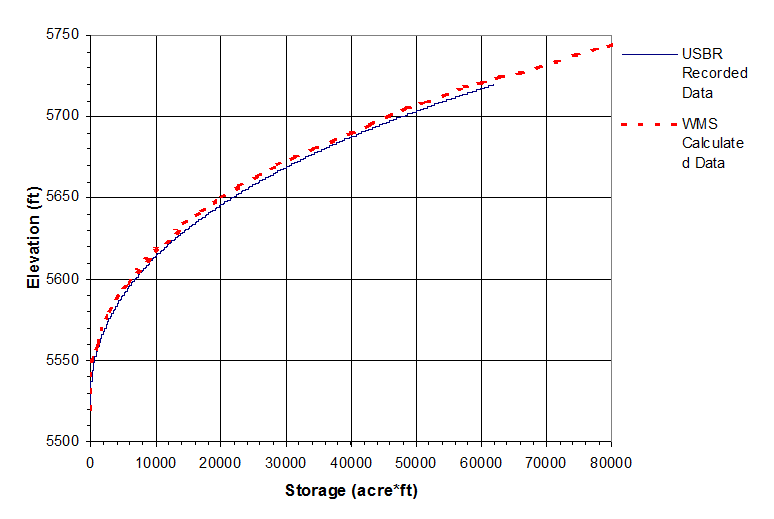 | 774 × 519 (19 KB) | Cmsmemoe (talk | contribs) |
You cannot overwrite this file.
File usage
The following page uses this file: