GMS:3D Mesh Display Options
From XMS Wiki
The properties of all 3D mesh data that GMS displays on the screen can be controlled through the 3D Mesh tab of the Display Options dialog. This dialog is opened by right-clicking on the ![]() 3D Mesh Data entry in the Project Explorer and selecting the Display Options command. It can also be accessed from the from the Display menu or the Display Options
3D Mesh Data entry in the Project Explorer and selecting the Display Options command. It can also be accessed from the from the Display menu or the Display Options ![]() macro. The following table describes the display options available for the 3D mesh module.
macro. The following table describes the display options available for the 3D mesh module.
| Display Option | Description |
|---|---|
| Nodes | The Nodes item is used to display the mesh nodes. |
| Element edges | The Elements item is used to display the edges of elements. The elements are drawn using the color of the material associated with each cell. An option is included to display all of the edges or only the edges on the boundary of each material. Element can also be temporarily hidden.
The color of the element edges can be adjusted according to the following options:
|
| Element faces | This option fills the elements with the material color. |
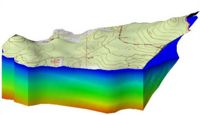
| Texture map image | The Texture Map Image item is used to "drape" an image over the top surface of the 3D Mesh. |
| Mesh shell | The Mesh shell item displays an edge for each of the edges on the exterior of the set of all elements (visible or invisible) which corresponds to a discontinuity in the mesh exterior. This display option provides a helpful spatial context when displaying isosurfaces or cross sections. |
| Feature angle | The mesh shell feature angle is used only when the Mesh Shell option is selected. This angle represents a threshold angle at which an edge of the shell will be displayed. If for example, an angle of 45 degrees is defined, any edge of the mesh which divides two element faces that are at an angle greater than 45 degrees to each other will not be displayed. |
| Node numbers | The Node numbers item displays the ID associated with each node next to the node. The numbers are only displayed on the front-facing faces of exterior elements. |
| Element numbers | The Element numbers item displays the ID associated with each element at the centroid of the element. The numbers are only displayed on the front-facing faces of exterior elements. |
| Scalar values | The Scalar Values item displays the scalar values of the active dataset for each node next to the node. |
| Contours | Most of the objects supported by GMS can be contoured by turning on the Contour Options in the Display Options dialog. When an object is contoured, the values associated with the active dataset for the object are used to generate the contours. |
| Vectors | If the Vectors item in the Display Options dialog is selected for an object (TIN, grid, or mesh), vector plots can be generated using the active vector dataset for the object. One vector is placed at each node, cell, or vertex. |
| Isosurfaces | If the Isosurfaces item in the Display Options dialog is selected for an object (3D grid or 3D mesh), isosurfaces will be generated. An isosurface is the 3D equivalent of a contour line. While a contour line is a line of constant value extracted from a surface, an isosurface is a surface of constant value extracted from a 3D dataset. |
File:Display3DMesh.jpg
The Display Options dialog showing the 3D Mesh tab.
| GMS – Groundwater Modeling System | ||
|---|---|---|
| Modules: | 2D Grid • 2D Mesh • 2D Scatter Point • 3D Grid • 3D Mesh • 3D Scatter Point • Boreholes • GIS • Map • Solid • TINs • UGrids | |
| Models: | FEFLOW • FEMWATER • HydroGeoSphere • MODAEM • MODFLOW • MODPATH • mod-PATH3DU • MT3DMS • MT3D-USGS • PEST • PHT3D • RT3D • SEAM3D • SEAWAT • SEEP2D • T-PROGS • ZONEBUDGET | |
| Aquaveo | ||
