GMS:Stress Periods
| MODFLOW | |
|---|---|
| Pre-processing | |
| MODFLOW Commands | |
| Building a MODFLOW Model | |
| Map to MODFLOW | |
| Calibration | |
| Packages Supported in GMS | |
| Saving a MODFLOW Simulation | |
| Importing MODFLOW Files | |
| Unsupported MODFLOW Features | |
| Run MODFLOW | |
| Post-processing | |
| MODFLOW Display Options | |
| MODFLOW Post-Processing Viewing Options | |
| Reading a MODFLOW Simulation | |
| Tutorials | |
| Packages | |
| Flow: | BCF6, HUF, LPF, UPW |
| Solvers: | SMS |
| Other: | UZF1 |
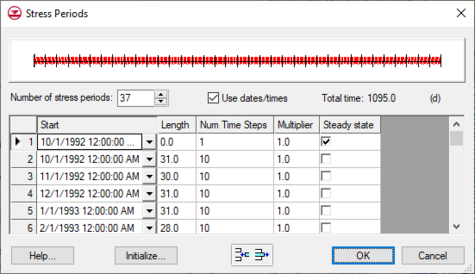
The computational time intervals for a MODFLOW simulation are called "stress periods". The transient stresses (pumping rates, river stages, etc.) can only change at the beginning of each stress period. Stress periods can be subdivided into smaller time steps, if desired. The Stress Periods button in the Global Options\Basic Package dialog is used to bring up the Stress Period dialog. The stress periods should be defined before any of the sources/sinks are entered. If the Steady State option in the Global Options\Basic Package dialog is selected, the Stress Periods button is dimmed.
Each stress period is now a single row in the spreadsheet. The stress period properties such as length and number of time steps can now be copied quickly and easily to other stress periods using the spreadsheet interface.
Initialize
A set of stress periods can be defined using the Initialize button. The Initialize button brings up a dialog which is used to generate a set of stress periods of constant length. The dialog prompts for a number of stress periods, a length, a number of time steps, and a time step multiplier. A set of stress periods is then generated and displayed graphically in the stress period plot.
Stress Period Plot
The horizontal strip at the top of the Stress Periods dialog is used to graphically edit stress periods. A stress period can be selected in the plot by clicking on the stress period with the mouse. The values associated with the selected stress period can be edited in the spreadsheet.
Insert Buttons
New stress periods can be added by selecting a stress period and selecting either the Insert Row ![]() button or by editing the last row in the spreadsheet. Stress periods can be deleted by selecting the stress periods and selecting the Remove Row
button or by editing the last row in the spreadsheet. Stress periods can be deleted by selecting the stress periods and selecting the Remove Row ![]() button.
button.
Reference Time
The first cell in the spreadsheet is used to enter the reference time for the MODFLOW simulation. The reference time is the date/time corresponding to the beginning of the simulation (t=0). If the Use Date/Times option is selected in the Time display section, all time values entered for transient input data, i.e., time series defined in the XY Series Editor can be entered in a date/time format rather than a scalar time format. Also, when post-processing, the values shown in the time step selector in the Data Browser or at the top of the GMS Window are displayed in the date/time format. Furthermore, any time series curves entered as part of the MODFLOW conceptual model in the Map module that were defined using the date/time format will be automatically converted to the proper time scale when the conceptual model is converted to grid-based numerical model.
| GMS – Groundwater Modeling System | ||
|---|---|---|
| Modules: | 2D Grid • 2D Mesh • 2D Scatter Point • 3D Grid • 3D Mesh • 3D Scatter Point • Boreholes • GIS • Map • Solid • TINs • UGrids | |
| Models: | FEFLOW • FEMWATER • HydroGeoSphere • MODAEM • MODFLOW • MODPATH • mod-PATH3DU • MT3DMS • MT3D-USGS • PEST • PHT3D • RT3D • SEAM3D • SEAWAT • SEEP2D • T-PROGS • ZONEBUDGET | |
| Aquaveo | ||
