Template:Relax UGrid Points: Difference between revisions
m (Protected "Template:Relax UGrid Points" ([Edit=Allow only administrators] (indefinite) [Move=Allow only administrators] (indefinite))) |
|||
| (4 intermediate revisions by the same user not shown) | |||
| Line 59: | Line 59: | ||
|Final Rr ||0.853 ||0.991 ||0.982 ||0.023 | |Final Rr ||0.853 ||0.991 ||0.982 ||0.023 | ||
|} | |} | ||
[[File:RelaxUGridPointsTool_Example1-2.png|thumb|none|400 px| Example 1 Figure 2]] | |||
Angle relax results with 5 iterations | Angle relax results with 5 iterations | ||
| Line 69: | Line 71: | ||
|Final Rr ||0.853 ||0.989 ||0.983 ||0.023 | |Final Rr ||0.853 ||0.989 ||0.983 ||0.023 | ||
|} | |} | ||
[[File:RelaxUGridPointsTool_Example1-3.png|thumb|none|400 px| Example 1 Figure 3]] | |||
Spring relax results with 5 iterations and constant size function of 5.0 | Spring relax results with 5 iterations and constant size function of 5.0 | ||
| Line 80: | Line 84: | ||
|} | |} | ||
[[File:RelaxUGridPointsTool_Example1-4.png|thumb|none|400 px| Example 1 Figure 4]] | |||
Lloyd relax results with 5 iterations | Lloyd relax results with 5 iterations | ||
| Line 90: | Line 95: | ||
|Final Rr ||0.855 ||0.989 ||0.980 ||0.025 | |Final Rr ||0.855 ||0.989 ||0.980 ||0.025 | ||
|} | |} | ||
[[File:RelaxUGridPointsTool_Example1-5.png|thumb|none|400 px| Example 1 Figure 5]] | |||
=====Example 2===== | =====Example 2===== | ||
This example shows a grid with a uniform boundary spacing (5.0) with dense distribution of points near the center of the grid. | This example shows a grid with a uniform boundary spacing (5.0) with dense distribution of points near the center of the grid. | ||
[[File:RelaxUGridPointsTool_Example2-1.png|thumb|none|400 px| Example 2 Figure 1]] | |||
Area relax results with 5 iterations | Area relax results with 5 iterations | ||
| Line 103: | Line 112: | ||
|Final Rr ||0.538 ||0.904 ||0.872 ||0.110 | |Final Rr ||0.538 ||0.904 ||0.872 ||0.110 | ||
|} | |} | ||
[[File:RelaxUGridPointsTool_Example2-2.png|thumb|none|400 px| Example 2 Figure 2]] | |||
Angle relax results with 5 iterations | Angle relax results with 5 iterations | ||
| Line 113: | Line 124: | ||
|Final Rr|| 0.376 ||0.928 ||0.889|| 0.117 | |Final Rr|| 0.376 ||0.928 ||0.889|| 0.117 | ||
|} | |} | ||
[[File:RelaxUGridPointsTool_Example2-3.png|thumb|none|400 px| Example 2 Figure 3]] | |||
Spring relax results with 5 iterations. | Spring relax results with 5 iterations. | ||
| Line 124: | Line 137: | ||
|- | |- | ||
|Final Rr ||0.358 ||0.935 ||0.881 ||0.136 | |Final Rr ||0.358 ||0.935 ||0.881 ||0.136 | ||
|} | |} | ||
[[File:RelaxUGridPointsTool_Example2-4.png|thumb|none|400 px| Example 2 Figure 4]] | |||
Lloyd relax results with 5 iterations | Lloyd relax results with 5 iterations | ||
{| class="wikitable" | {| class="wikitable" | ||
| Line 134: | Line 150: | ||
|Final Rr ||0.394 ||0.872 ||0.831 ||0.144 | |Final Rr ||0.394 ||0.872 ||0.831 ||0.144 | ||
|} | |} | ||
[[File:RelaxUGridPointsTool_Example2-5.png|thumb|none|400 px| Example 2 Figure 5]] | |||
Lloyd relax results with 5 iterations and optimize triangulation turned on. | Lloyd relax results with 5 iterations and optimize triangulation turned on. | ||
| Line 144: | Line 162: | ||
|Final Rr ||0.582 ||0.939 ||0.915 ||0.082 | |Final Rr ||0.582 ||0.939 ||0.915 ||0.082 | ||
|} | |} | ||
[[File:RelaxUGridPointsTool_Example2-6.png|thumb|none|400 px| Example 2 Figure 6]] | |||
=====Example 3===== | =====Example 3===== | ||
This example shows a grid with a non-uniform boundary spacing. Note the longer boundary edge of the cell within the red box in the image below. | This example shows a grid with a non-uniform boundary spacing. Note the longer boundary edge of the cell within the red box in the image below. | ||
[[File:RelaxUGridPointsTool_Example3-1.png|thumb|none|400 px| Example 3 Figure 1]] | |||
Area relax results with 5 iterations. | Area relax results with 5 iterations. | ||
| Line 158: | Line 180: | ||
|Final Rr ||0.267 ||0.928 ||0.902 ||0.102 | |Final Rr ||0.267 ||0.928 ||0.902 ||0.102 | ||
|} | |} | ||
[[File:RelaxUGridPointsTool_Example3-2.png|thumb|none|400 px| Example 3 Figure 2]] | |||
Angle relax results with 5 iterations | Angle relax results with 5 iterations | ||
| Line 170: | Line 194: | ||
|} | |} | ||
[[File:RelaxUGridPointsTool_Example3-3.png|thumb|none|400 px| Example 3 Figure 3]] | |||
Spring relax results with 5 iterations and a size function computed from the initial point spacing | Spring relax results with 5 iterations and a size function computed from the initial point spacing | ||
| Line 181: | Line 206: | ||
|Final Rr ||0.092 ||0.923 ||0.897 ||0.115 | |Final Rr ||0.092 ||0.923 ||0.897 ||0.115 | ||
|} | |} | ||
[[File:RelaxUGridPointsTool_Example3-4.png|thumb|none|400 px| Example 3 Figure 4]] | |||
Lloyd relax results with 5 iterations and optimize triangulation turned on. | Lloyd relax results with 5 iterations and optimize triangulation turned on. | ||
| Line 192: | Line 219: | ||
|Final Rr ||0.239 ||0.947 ||0.920 ||0.101 | |Final Rr ||0.239 ||0.947 ||0.920 ||0.101 | ||
|} | |} | ||
[[File:RelaxUGridPointsTool_Example3-5.png|thumb|none|400 px| Example 3 Figure 5]] | |||
=====Example 4===== | =====Example 4===== | ||
This example shows a grid with fairly uniform boundary spacing and an internal feature that will be preserved using the locked nodes feature. The locked nodes are shown with dark red symbols. | This example shows a grid with fairly uniform boundary spacing and an internal feature that will be preserved using the locked nodes feature. The locked nodes are shown with dark red symbols. | ||
[[File:RelaxUGridPointsTool_Example4-1.png|thumb|none|400 px| Example 4 Figure 1]] | |||
Area relax results with 5 iterations. | Area relax results with 5 iterations. | ||
| Line 206: | Line 237: | ||
|} | |} | ||
[[File:RelaxUGridPointsTool_Example4-2.png|thumb|none|400 px| Example 4 Figure 2]] | |||
Angle relax results with 5 iterations | Angle relax results with 5 iterations | ||
| Line 217: | Line 249: | ||
|} | |} | ||
[[File:RelaxUGridPointsTool_Example4-3.png|thumb|none|400 px| Example 4 Figure 3]] | |||
Spring relax results with 5 iterations and a size function computed from the initial point spacing | Spring relax results with 5 iterations and a size function computed from the initial point spacing | ||
| Line 228: | Line 261: | ||
|} | |} | ||
[[File:RelaxUGridPointsTool_Example4-4.png|thumb|none|400 px| Example 4 Figure 4]] | |||
Lloyd relax results with 5 iterations and optimize triangulation turned on. | Lloyd relax results with 5 iterations and optimize triangulation turned on. | ||
| Line 239: | Line 273: | ||
|} | |} | ||
[[File:RelaxUGridPointsTool_Example4-5.png|thumb|none|400 px| Example 4 Figure 5]] | |||
{{-}} | {{-}} | ||
<noinclude>[[Category:Toolbox UGrid]]</noinclude> | <noinclude>[[Category:Toolbox UGrid]]</noinclude> | ||
Latest revision as of 23:21, 11 December 2023
Relax UGrid Points
The Relax UGrid Points' tool adjusts point locations attempting to improve the quality of connected triangle cells. Usually the overall quality of the grid will improve but not in all cases. Some examples are of the tool are shown below.
Input parameters
- UGrid – Select the grid in the project that will have its points relaxed.
- Relaxation method – Select the desired relaxation method.
- "Area" – This method calculates the new location of a particular point by finding the centroid and area of all surrounding triangles and then computing a new location that is the weighted average of the triangle centroids. The weights are determined by the triangle area divided by the total area of all triangles connected to the point.
- "Angle" – This method attempts to make all the angles connected to a point equal. The new location is calculated such that the difference between connected angles is minimized.
- "Spring" – This method uses a size function (desired edge length) and spring force equation to move a point to the location that best satisfies the size function.
- "Lloyd" – This method is similar to area relax but seeks to move the particular point to the centroid of the voronoi polygon. It is recommended to use the “Optimize triangulation” when using the Lloyd relaxation option.
- See Wikipedia Lloyd’s algorithm - Lloyd's algorithm
- Implemented with guidelines from “Efficient mesh optimization schemes base on Optimal Delaunay Triangulations” Chen, Holst 2011)
- Number of iterations – The number of iterations to perform with the relaxation method
- Convergence distance – Early termination of the tool will occur if the maximum distance any point moves during an iteration is less than the convergence distance.
- Locked points dataset – A dataset where any nonzero value indicates that the point/node is locked and will not have its location adjusted by the tool.
- Spring relax size dataset – A dataset indicating the desired edge size at each point/node in the grid. This dataset must be specified if the relaxation method is “Spring”.
- Optimize triangulation – Before each smoothing step the triangles are checked to ensure they meet the Delaunay criteria. Any triangles that are not Delaunay compliant will be adjusted to satisfy the Delaunay criteria.
Output parameters
- Relaxed output grid name – Name of the output grid produced by the tool.
Outline of the tool algorithm
A basic outline of the algorithm is as follows:
- Build a list of all triangles in the input grid
- If optimizing the triangulation
- Ensure triangles satisfy Delaunay criterion
- Compute the initial quality of all triangles
- Ensure that all boundary points are locked (they may not move)
- For each iteration
- Compute the new location of all points using the specified method
- Check if the new locations will create any invalid triangles
- If invalid triangles are created then calculate new locations that are half the distance to the previous new locations and check again for invalid triangles
- Check for convergence if the maximum distance moved by any point is less than the convergence distance
- If convergence is not met and optimizing triangulation, optimize the triangles
- Compute final triangle quality
- Create the output grid
Discussion
Which smoothing option should I use? The answer to this question almost always depends on the particular application. The following are guidelines to help answer that question.
- Area relaxation and Lloyd relaxation produce similar results. Lloyd relaxation will typically move the points further from their original locations than area. This may be desirable in some application.
- Angle relaxation often gives better results than area relaxation when there is considerable area difference between triangles connected at a given point.
- Spring relaxation makes the most sense to use when the grid/mesh has been developed using a size function for the domain. Additionally, the boundaries used to generate the grid/mesh should be consistent with the size function.
Examples
Example 1
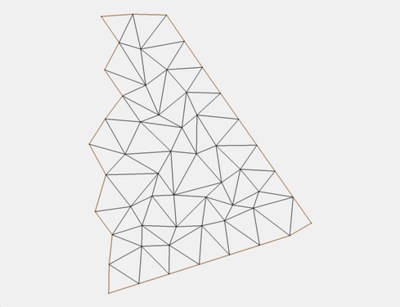
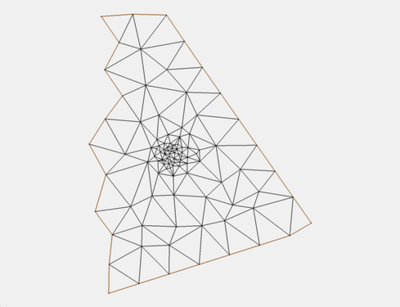
This example shows a grid with a uniform boundary spacing (5.0) with distribution of points on the interior.
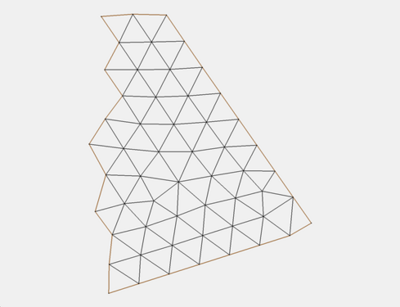
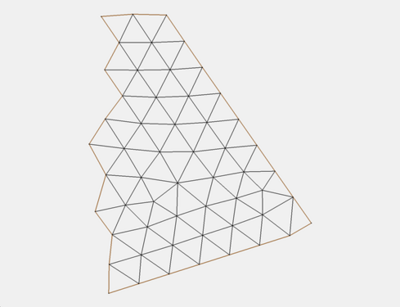
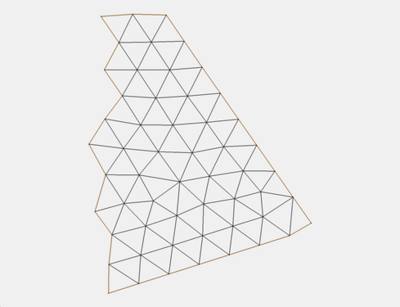
- In this example, all of the relaxation methods perform well. The overall final cell/element quality is extremely high and the grids would be satisfactory for numerical analysis.
Area relax results with 5 iterations
| Quality | Min | Median | Mean | Std. Dev. |
| Initial Rr | 0.286 | 0.903 | 0.843 | 0.161 |
| Final Rr | 0.853 | 0.991 | 0.982 | 0.023 |
Angle relax results with 5 iterations
| Quality | Min | Median | Mean | Std. Dev. |
| Initial Rr | 0.286 | 0.903 | 0.843 | 0.161 |
| Final Rr | 0.853 | 0.989 | 0.983 | 0.023 |
Spring relax results with 5 iterations and constant size function of 5.0
| Quality | Min | Median | Mean | Std. Dev. |
| Initial Rr | 0.286 | 0.903 | 0.843 | 0.161 |
| Final Rr | 0.853 | 0.988 | 0.981 | 0.025 |
Lloyd relax results with 5 iterations
| Quality | Min | Median | Mean | Std. Dev. |
| Initial Rr | 0.286 | 0.903 | 0.843 | 0.161 |
| Final Rr | 0.855 | 0.989 | 0.980 | 0.025 |
Example 2
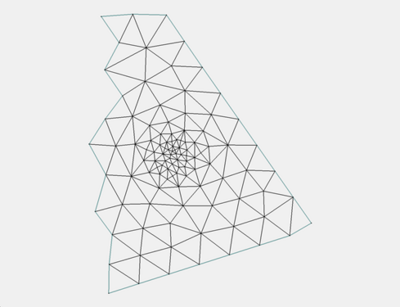
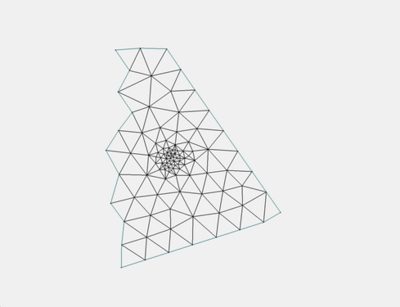
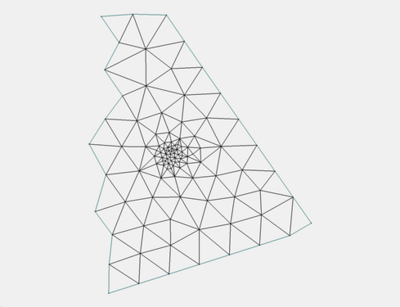
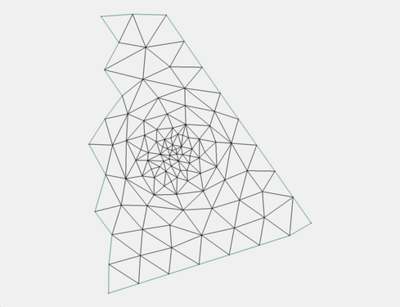
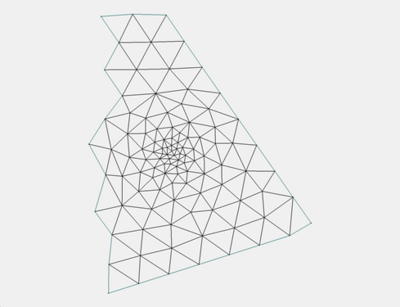
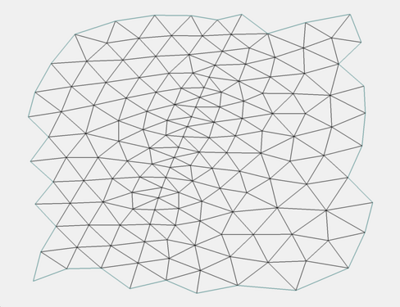
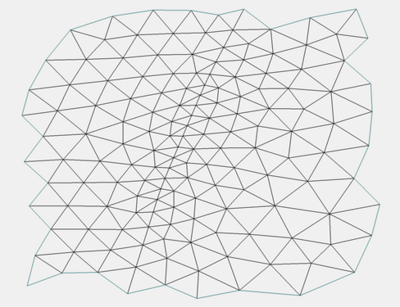
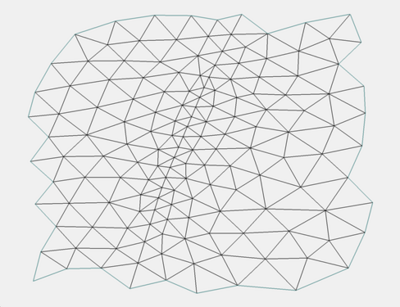
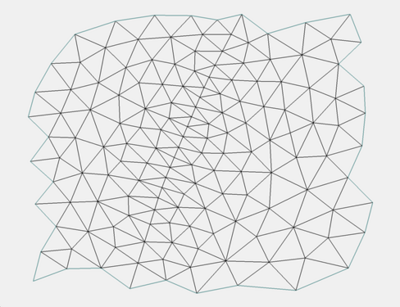
This example shows a grid with a uniform boundary spacing (5.0) with dense distribution of points near the center of the grid.
Area relax results with 5 iterations
| Quality | Min | Median | Mean | Std. Dev. |
| Initial Rr | 0.392 | 0.853 | 0.812 | 0.155 |
| Final Rr | 0.538 | 0.904 | 0.872 | 0.110 |
Angle relax results with 5 iterations
| Quality | Min | Median | Mean | Std. Dev. |
| Initial Rr | 0.392 | 0.853 | 0.812 | 0.155 |
| Final Rr | 0.376 | 0.928 | 0.889 | 0.117 |
Spring relax results with 5 iterations.
- Size function computed from the initial point spacing.
- Notice that the minimum quality metric decreased; the cell with the worst quality has become even worse.
| Quality | Min | Median | Mean | Std. Dev. |
| Initial Rr | 0.392 | 0.853 | 0.812 | 0.155 |
| Final Rr | 0.358 | 0.935 | 0.881 | 0.136 |
Lloyd relax results with 5 iterations
| Quality | Min | Median | Mean | Std. Dev. |
| Initial Rr | 0.392 | 0.853 | 0.812 | 0.155 |
| Final Rr | 0.394 | 0.872 | 0.831 | 0.144 |
Lloyd relax results with 5 iterations and optimize triangulation turned on.
| Quality | Min | Median | Mean | Std. Dev. |
| Initial Rr | 0.392 | 0.853 | 0.812 | 0.155 |
| Final Rr | 0.582 | 0.939 | 0.915 | 0.082 |
Example 3
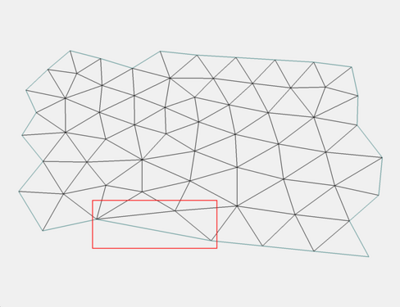
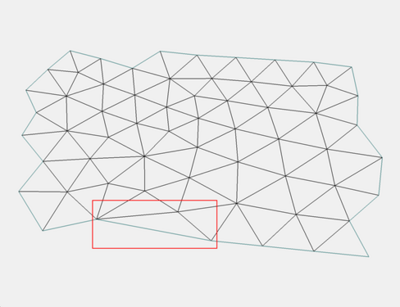
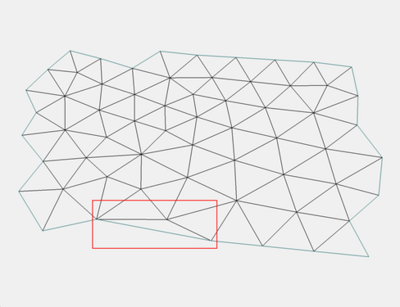
This example shows a grid with a non-uniform boundary spacing. Note the longer boundary edge of the cell within the red box in the image below.
Area relax results with 5 iterations.
- The overall quality of the grid improves slightly. However, notice that the minimum quality metric has decreased; the cell with the worst quality has become even worse.
| Quality | Min | Median | Mean | Std. Dev. |
| Initial Rr | 0.371 | 0.921 | 0.899 | 0.093 |
| Final Rr | 0.267 | 0.928 | 0.902 | 0.102 |
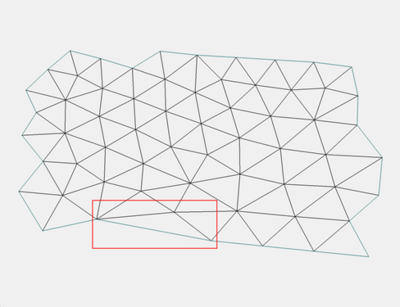
Angle relax results with 5 iterations
- Similar to area relax. The overall quality of the grid improves slightly. However, notice that the minimum quality metric has decreased; the cell with the worst quality has become even worse.
| Quality | Min | Median | Mean | Std. Dev. |
| Initial Rr | 0.371 | 0.921 | 0.899 | 0.093 |
| Final Rr | 0.264 | 0.924 | 0.901 | 0.103 |
Spring relax results with 5 iterations and a size function computed from the initial point spacing
- This is difficult problem for the spring relax to solve because of the constrained boundary. Ideally, the boundary would be consistent with an overall size function that would be applied during the meshing process.
| Quality | Min | Median | Mean | Std. Dev. |
| Initial Rr | 0.371 | 0.921 | 0.899 | 0.093 |
| Final Rr | 0.092 | 0.923 | 0.897 | 0.115 |
Lloyd relax results with 5 iterations and optimize triangulation turned on.
- Similar to area relax. The overall quality of the grid improves slightly. However, notice that the minimum quality metric has decreased; the cell with the worst quality has become even worse.
| Quality | Min | Median | Mean | Std. Dev. |
| Initial Rr | 0.371 | 0.921 | 0.899 | 0.093 |
| Final Rr | 0.239 | 0.947 | 0.920 | 0.101 |
Example 4
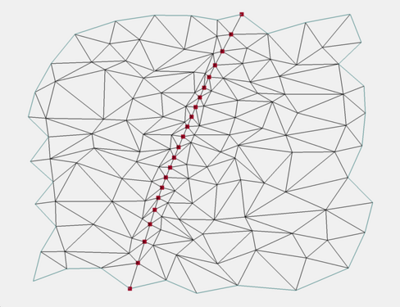
This example shows a grid with fairly uniform boundary spacing and an internal feature that will be preserved using the locked nodes feature. The locked nodes are shown with dark red symbols.
Area relax results with 5 iterations.
| Quality | Min | Median | Mean | Std. Dev. |
| Initial Rr | 0.122 | 0.792 | 0.736 | 0.201 |
| Final Rr | 0.544 | 0.899 | 0.878 | 0.093 |
Angle relax results with 5 iterations
| Quality | Min | Median | Mean | Std. Dev. |
| Initial Rr | 0.122 | 0.792 | 0.736 | 0.201 |
| Final Rr | 0.522 | 0.913 | 0.889 | 0.087 |
Spring relax results with 5 iterations and a size function computed from the initial point spacing
| Quality | Min | Median | Mean | Std. Dev. |
| Initial Rr | 0.122 | 0.792 | 0.736 | 0.201 |
| Final Rr | 0.500 | 0.909 | 0.883 | 0.096 |
Lloyd relax results with 5 iterations and optimize triangulation turned on.
| Quality | Min | Median | Mean | Std. Dev. |
| Initial Rr | 0.122 | 0.792 | 0.736 | 0.201 |
| Final Rr | 0.590 | 0.927 | 0.898 | 0.091 |
