User:Jcreer/Archived Images: Difference between revisions
From XMS Wiki
Jump to navigationJump to search
| (177 intermediate revisions by the same user not shown) | |||
| Line 27: | Line 27: | ||
|[[File:Sandbox.png|20 px]] | |[[File:Sandbox.png|20 px]] | ||
|[[File:Template-info.png|20px]] | |[[File:Template-info.png|20px]] | ||
| | |[[File:CityWaterSystemFlowBalanceIcon.png|20 px]] | ||
|[[File:Mf6clean.svg|16 px]] | |||
|[[File:Ahgw selection tool pro.png|16 px]] | |||
|[[File:Palette forward.svg|16 px]] | |||
|[[File:Palette reverse.svg|16 px]] | |||
|- | |- | ||
|[[File:Wikibooks-logo.png|20 px]] | |[[File:Wikibooks-logo.png|20 px]] | ||
| Line 36: | Line 41: | ||
|[[File:Windows - New Folder icon.png]] | |[[File:Windows - New Folder icon.png]] | ||
|[[File:Cursor - Pointer Finger.png]] | |[[File:Cursor - Pointer Finger.png]] | ||
|[[File:Get Data Tool icon inactive.png]] | |[[File:Get Data Tool icon inactive.png]] | ||
|[[File:Vector Options macro inactive.png]] | |[[File:Vector Options macro inactive.png]] | ||
|[[File:FrontView icon.png]] | |||
|[[File:ObliqueView icon.png]] | |||
|[[File:PreviousView icon.png]] | |||
|[[File:SideView icon.png]] | |||
|[[File:TethyWaterQualityOptionsIcon.png|16 px]] | |||
|[[File:EPA SWMM Add button from Time Series Plot Selection dialog.png|20 px]] | |||
|[[File:Mf6sim mod.svg|16 px]] | |||
|[[File:WMS GetDataToolIcon2.svg|16 px]] | |||
|[[File:ArcGIS Select Date button.png|16 px]] | |||
|[[File:Reverse Ramp Colors Button.png|16 px]] | |||
|[[File:Materials-edit.svg|16 px]] | |||
|- | |- | ||
|[[File:Contour Options macro inactive.png]] | |[[File:Contour Options macro inactive.png]] | ||
| Line 59: | Line 68: | ||
|[[File:Increment down arrow.png]] | |[[File:Increment down arrow.png]] | ||
|[[File:Increment up arrow.png]] | |[[File:Increment up arrow.png]] | ||
|[[File:Tree DataSetActive.png]] | |[[File:Tree DataSetActive.png]] | ||
|[[File:MapDataTree.jpg]] | |[[File:MapDataTree.jpg]] | ||
|[[File:Mf6project.svg| 16 px]] | |||
|[[File:Select Centerline Tool.svg|16 px]] | |||
|[[File:SMS Select Cross Section Tool.svg|16 px]] | |||
|[[File:Ugrid-3D-rectilinear-quadtree-icon.png|16 px]] | |||
|- | |- | ||
|[[File:Coverage icon - inactive.png]] | |[[File:Coverage icon - inactive.png]] | ||
|[[File:Hydrologic Inactive Icon.svg|16 px]] | |[[File:Hydrologic Inactive Icon.svg|16 px]] | ||
|[[File:SaveIcon.jpg]] | |[[File:SaveIcon.jpg]] | ||
|[[File:HEC-HMS Project Explorer basin icon.png]] | |[[File:HEC-HMS Project Explorer basin icon.png]] | ||
| Line 74: | Line 85: | ||
|[[File:HEC-HMS Project Explorer sub-basin icon.png]] | |[[File:HEC-HMS Project Explorer sub-basin icon.png]] | ||
|[[File:SVG logo.svg|20 px]] | |[[File:SVG logo.svg|20 px]] | ||
|[[File:EPA SWMM Create a Profile Plot icon.png|16 px]] | |[[File:EPA SWMM Create a Profile Plot icon.png|16 px]] | ||
|[[File:EPA SWMM Time Series Plot button.png|16 px]] | |[[File:EPA SWMM Time Series Plot button.png|16 px]] | ||
|[[File:SMS 3D Cartesian Grid Module Icon.png]] | |[[File:SMS 3D Cartesian Grid Module Icon.png]] | ||
|[[File: | |[[File:ArcGIS Database icon.png]] | ||
|[[File: | |[[File:ArcGIS Catalog icon.png]] | ||
|[[File: | |[[File:Mf6lock.svg|16 px]] | ||
|[[File: | |[[File:MF6 GroundwaterModel Icon.png|16 px]] | ||
|[[File:Windows10 Close button.png|16 px]] | |||
|[[File: | |||
|} | |} | ||
| Line 108: | Line 105: | ||
|[[File:GmsBannerR.png|100 px]] | |[[File:GmsBannerR.png|100 px]] | ||
|[[File:Aquaveo logo with water drop.png|100 px]] | |[[File:Aquaveo logo with water drop.png|100 px]] | ||
|[[File:GSDA CGIAR.png|thumb|100 px]] | |||
|[[File:GSDA USGS-EPA logo.png|thumb|100 px]] | |||
|- | |- | ||
|[[File:Water waves with logo.png|thumb|100 px]] | |[[File:Water waves with logo.png|thumb|100 px]] | ||
|[[File:Water waves with logo on top.png|thumb|100 px]] | |[[File:Water waves with logo on top.png|thumb|100 px]] | ||
|[[File:Aquaveo logo background colors.png|thumb|5 px]] | |[[File:Aquaveo logo background colors.png|thumb|5 px]] | ||
| | |[[File:NGDC.png|thumb|100 px]] | ||
| | |[[File:GSDA USDA-NRCS logo.png|thumb|100 px]] | ||
| | |[[File:GSDA NWISWeb logo.png|thumb|100 px]] | ||
| | |[[File:Lpdaac.png|thumb|100 px]] | ||
|- | |||
|[[File:GSDA ESRI Logo.png|thumb|20 px]] | |||
|[[File:GSDA USGS.png|thumb|100 px]] | |||
|[[File:GSDA webGIS.png|thumb|80 px]] | |||
|[[File:GSDA MapMart.png|thumb|100 px]] | |||
|[[File:GSDA GeoCommunity.png|thumb|100 px]] | |||
|[[File:GSDA LandInfo.png|thumb|100 px]] | |||
|[[File:GSDA GeoBase.png|thumb|100 px]] | |||
|} | |} | ||
| Line 152: | Line 160: | ||
|[[File:WMS MWBM Model Changes.jpg|thumb|100px]] | |[[File:WMS MWBM Model Changes.jpg|thumb|100px]] | ||
|[[File:WMS MWBM Outlet Locations.jpg|thumb|100 px]] | |[[File:WMS MWBM Outlet Locations.jpg|thumb|100 px]] | ||
|- | |||
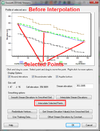
|[[File:GsshaStormDrainElevationInterpFig2.png|thumb|100 px]] | |||
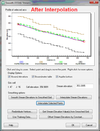
|[[File:GsshaStormDrainElevationInterpFig3.png|thumb|100 px]] | |||
|[[File:GsshaStormDrainAdverseSlopeFig2.png|thumb|100 px]] | |||
|[[File:GsshaStormDrainPipeNodeParamsFig1.png|thumb|100 px]] | |||
|[[File:GsshaStormDrainIdentifyNodesFig1.png|thumb|100 px]] | |||
|[[File:GsshaStormDrainHydrographsFig1.png|thumb|100 px]] | |||
|- | |||
|[[File:SMS Pref Images.jpg|thumb|100 px]] | |||
|[[File:Filter Arc Segments Tool.jpg|thumb|100 px]] | |||
|[[File:Filter Arcs Tool.jpg|thumb|100 px]] | |||
|[[File:SMS UGrid Display.png|thumb|100 px]] | |||
|[[File:SMS MaterialProperties.jpg|thumb|100 px]] | |||
|[[File:HEC1OutputControlDialog.png|thumb|100 px]] | |||
|- | |||
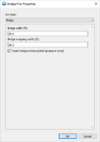
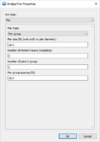
|[[File:Bridge-pier-unassigned.png|thumb|100 px]] | |||
| [[File:Bridge-pier-bridge.png|thumb|100 px]] | |||
| [[File:Bridge-pier-pier-piergroup.png|thumb|100 px]] | |||
| [[File:Bridge-pier-abutment.png|thumb|100 px]] | |||
| [[File:ArcGIS Pro Create XS2D Cross Section.png|thumb|50 px]] | |||
| [[File:SMS CrossSectionFeatures.png|thumb|100 px]] | |||
|- | |||
| [[File:WAM Cell Attibutes.jpg|thumb|100 px]] | |||
| [[File:CMSWaveModelControl.png|thumb|100 px]] | |||
| [[File:SMS Display Opts General 13.0.png|thumb|100 px]] | |||
| [[File:Raster-to-flood-depths.png|thumb|100 px]] | |||
| [[File:Mapviewerbutton.png|thumb|100 px]] | |||
| [[File:Create Spectral Energy.jpg| thumb | 100 px]] | |||
|} | |} | ||
{|class="mw-collapsible mw-collapsed" style="width:1050px; border:1px solid #D0E0FF; margin-bottom:0.4em;" | {|class="mw-collapsible mw-collapsed" style="width:1050px; border:1px solid #D0E0FF; margin-bottom:0.4em;" | ||
| Line 166: | Line 202: | ||
|- | |- | ||
|[[File:PreferencesSEAWAT.jpg|thumb|100px]] | |[[File:PreferencesSEAWAT.jpg|thumb|100px]] | ||
|[[File: | |[[File:Spectral Grid Attributes dialog.png|thumb | 100 px]] | ||
|[[File:MODFLOW-MNWIpackage.jpg|thumb|100px]] | |[[File:MODFLOW-MNWIpackage.jpg|thumb|100px]] | ||
|[[File:MODFLOW-SUB-Delay.jpg|thumb|100px]] | |[[File:MODFLOW-SUB-Delay.jpg|thumb|100px]] | ||
| Line 188: | Line 224: | ||
|[[File:GsshaOverlandFlowBcRatingCurves.png|thumb|100 px]] | |[[File:GsshaOverlandFlowBcRatingCurves.png|thumb|100 px]] | ||
|[[File:GsshaOverlandOutput.png|thumb|100 px]] | |[[File:GsshaOverlandOutput.png|thumb|100 px]] | ||
|- | |||
|[[File:GsshaStormDrainHydrographsFig2.png|thumb|100px]] | |||
|[[File:GsshaInsetModelModelLinkageOutput.png|thumb|100px]] | |||
|[[File:GsshaInsetModelLinkToChildXY.png|thumb|100px]] | |||
|[[File:NutrientsJobControl.jpg|thumb|100px]] | |||
|[[File:GSSHAStreamIndexMap.jpg|thumb|100px]] | |||
|[[File:SMS Info Raster.jpg|thumb|100px]] | |||
|[[File:GridGenerator.png|thumb|100px]] | |||
|} | |} | ||
{|class="mw-collapsible mw-collapsed" style="width:1050px; border:1px solid #D0E0FF; margin-bottom:0.4em;" | {|class="mw-collapsible mw-collapsed" style="width:1050px; border:1px solid #D0E0FF; margin-bottom:0.4em;" | ||
| Line 200: | Line 244: | ||
|[[File:FESWMS Nodestring BC.jpg|thumb|100px]] | |[[File:FESWMS Nodestring BC.jpg|thumb|100px]] | ||
|[[File:GIS SelectData.png|thumb|100px]] | |[[File:GIS SelectData.png|thumb|100px]] | ||
|- | |- | ||
|[[File:EditTR20ParametersQuick.jpg|thumb|100px]] | |[[File:EditTR20ParametersQuick.jpg|thumb|100px]] | ||
| Line 210: | Line 253: | ||
|[[File:TUFLOW AD MinDispersion.png|thumb|100px]] | |[[File:TUFLOW AD MinDispersion.png|thumb|100px]] | ||
|- | |- | ||
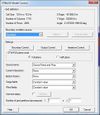
|[[File:HMSjobcontrol. | |[[File:HMSjobcontrol.png|thumb|100 px]] | ||
|[[File:Featstamp.png|thumb|100 px]] | |[[File:Featstamp.png|thumb|100 px]] | ||
|[[File:ZShape properties dialog.jpg|thumb|100 px]] | |[[File:ZShape properties dialog.jpg|thumb|100 px]] | ||
| Line 222: | Line 265: | ||
|[[File:GsshaLakeOptions.png|thumb|100 px]] | |[[File:GsshaLakeOptions.png|thumb|100 px]] | ||
|[[File:GSSHA Lakes and Wetlands.jpg|thumb|100 px]] | |[[File:GSSHA Lakes and Wetlands.jpg|thumb|100 px]] | ||
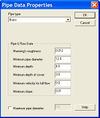
|[[File:GsshaPipeArcProperties.png|thumb|100 px]] | |||
|[[File:GsshaPipePointProperties.png|thumb|100 px]] | |||
|[[File:GsshaStormDrainRedistributeFig2.png|thumb|100 px]] | |||
|- | |||
| | |||
|[[File:RasterDialog.png|thumb|100 px]] | |||
|[[File:AHGW Subsurface Analyst Features - Desurvey Borelog.png|thumb|100 px]] | |||
|[[File:AHGW Create XS2D Panel Feature Class dialog.jpg|thumb|100 px]] | |||
|[[File:AHGW Time Series Grapher Setup dialog.jpg|thumb|100 px]] | |||
|[[File:Scatter Grid frame.jpg|thumb|100 px]] | |||
|[[File:AHGW HGU Setup Dialog.png|thumb|100 px]] | |||
|- | |||
|[[File:SMS Clean.png|thumb|100 px]] | |||
|[[File:Units Dialog WMS.PNG|thumb|100 px]] | |||
|[[File:Compute NSTPS Dialog (From Channel).PNG|thumb|100 px]] | |||
|[[File:Define MA Data Dialog WMS.PNG|thumb|100 px]] | |||
|[[File:SMS GIS Display.png|thumb|100 px]] | |||
|[[File:WMS Pref Image Pref.jpg|thumb|100 px]] | |||
|[[File:Contour Label.png|thumb|100 px]] | |||
|} | |||
==AHGW Dialogs== | |||
<!--DO NOT UPDATE IMAGES ON THIS PAGE. This page is for archiving unused images that may be used in the future.--> | |||
<!--Images on this page that are being used elsewhere should be removed from this page.--> | |||
{|class="mw-collapsible mw-collapsed" style="width:1050px; border:1px solid #D0E0FF; margin-bottom:0.4em;" | |||
|- | |||
!style="text-align:left;"|AHGW Dialog images | |||
|- | |||
|[[File:AHGW Borehole Editor dialog.jpg|thumb|100 px]] | |||
|[[File:AHGW HGU Color Manager Dialog.png|thumb|100 px]] | |||
|[[File:Create AHGW Raster Catalog.png|thumb|100 px]] | |||
|[[File:Create Blank AHGW Geodatabase dialog.png|thumb|100 px]] | |||
|[[File:Create Unique ID Table dialog.png|thumb|100 px]] | |||
|[[File:Modify AHGW Geodatabase dialog.png|thumb|100 px]] | |||
|[[File:Create Well Feature Class dialog.png|thumb|100 px]] | |||
|[[File:Create Time Series Tables dialog.png|thumb|100 px]] | |||
|- | |||
|[[File:AHGW Desurvey Borelog dialog.png|thumb|100 px]] | |||
|[[File:AHGW Create Non-Vertical Borelines Dialog.png|thumb|100 px]] | |||
|[[File:AHGW Subsurface Analyst Features - Borehole Data to Borepoints.png|thumb|100 px]] | |||
|[[File:AHGW Subsurface Analyst Features - BoreholeLog Table to Points.png|thumb|100 px]] | |||
|[[File:AHGW Subsurface Analyst Features - Create BoreLines.png|thumb|100 px]] | |||
|[[File:AHGW Subsurface Analyst Features - Create BoreLines.png|thumb|100 px]] | |||
|[[File:AHGW Subsurface Analyst Features - Create BorePoints.png|thumb|100 px]] | |||
|[[File:AHGW Subsurface Analyst Features - Create GeoSection Feature Class.png|100 px]] | |||
|- | |||
|[[File:AHGW Subsurface Analyst Features - Create GeoVolume Feature Class.png|thumb|100 px]] | |||
|[[File:AHGW Subsurface Analyst Features - Create SectionLine Feature Class.png|thumb|100 px]] | |||
|[[File:AHGW Subsurface Analyst Features - GeoSection to Points.png|thumb|100 px]] | |||
|[[File:AHGW Subsurface Analyst Features - Rasters to GeoSections.png|thumb|100 px]] | |||
|[[File:AHGW Subsurface Analyst Features - Rasters to GeoVolumes.png|thumb|100 px]] | |||
|[[File:AHGW Subsurface Analyst TIN - Polygon to TIN.png|thumb|100 px]] | |||
|[[File:AHGW Subsurface Analyst XS2D Editor - Create XS2D Geophysical Plot Feature Classes.png|thumb|100 px]] | |||
|[[File:AHGW Subsurface Analyst XS2D Editor - Create XS2D Geophysical Plot Features.png|thumb|60 px]] | |||
|- | |||
|[[File:Assign HydroID GW dialog.png|thumb|100 px]] | |||
|[[File:AHGW Subsurface Analyst XS2D Editor - Create XS2D Boreline Feature Class.png|thumb|100 px]] | |||
|[[File:AHGW Subsurface Analyst XS2D Editor - Create XS2D Grid.png|thumb|100 px]] | |||
|[[File:AHGW Subsurface Analyst XS2D Editor - Create XS2D Panel Divider.png|thumb|100 px]] | |||
|[[File:AHGW Subsurface Analyst XS2D Editor - Create XS2D Panel Feature Class.png|thumb|100 px]] | |||
|[[File:AHGW Subsurface Analyst XS2D Editor - Create XS2D Point Feature Class.png|thumb|100 px]] | |||
|[[File:AHGW Subsurface Analyst XS2D Editor - Create XS2D Polygon Feature Class.png|thumb|100 px]] | |||
|[[File:AHGW Subsurface Analyst XS2D Editor - Create XS2D Catalog Table.png|thumb|100 px]] | |||
|- | |||
|[[File:AHGW Subsurface Analyst XS2D Editor - NonVertical Boreline to XS2D.png|100 px]] | |||
|[[File:AHGW Subsurface Analyst XS2D Editor - Reverse Section Line Orientation.png|100 px]] | |||
|[[File:AHGW Subsurface Analyst XS2D Editor - Scale XS2D Features.png|100 px]] | |||
|[[File:AHGW Subsurface Analyst XS2D Editor - Transform XS2D Lines to Points.png|100 px]] | |||
|[[File:AHGW Subsurface Analyst XS2D Editor - Transform XS2D Panel to GeoSection.png|100 px]] | |||
|[[File:AHGW Subsurface Analyst XS2D Editor - Transform XS2D Well Detail Line.png|100 px]] | |||
|[[File:AHGW Subsurface Analyst XS2D Editor - Transform XS2D Well Detail Polygon.png|100 px]] | |||
|[[File:AHGW Subsurface Analyst XS2D Editor - Create XS2D Line Feature Class.png|100 px]] | |||
|- | |||
|[[File:AHGW Subsurface Analyst XS2D Editor - Transform Polygons to XS2D Lines.png|100 px]] | |||
|[[File:AHGW Subsurface Analyst XS2D Editor - Transform Points to XS2D Points.png|100 px]] | |||
|[[File:AHGW Subsurface Analyst XS2D Editor - Transform Lines to XS2D Points.png|100 px]] | |||
|[[File:AHGW Arc Hydro Groundwater Toolkit dialog.png|100 px]] | |||
|[[File:Register AHGW dialog.png|75 px]] | |||
|[[File:AHGW Subsurface Analyst XS2D Editor - Transform GeoSection to XS2D Panel.png|100 px]] | |||
|[[File:AHGW Subsurface Analyst XS2D Editor - Transform Raster to XS2D Line.png|100 px]] | |||
|[[File:AHGW Subsurface Analyst XS2D Editor - Transform Faults to XS2D Lines.png|100 px]] | |||
|- | |||
|[[File:AHGW 2D Cross Section Wizard dialog Step 1.png|100 px]] | |||
|[[File:AHGW 2D Cross Section Wizard dialog Step 2.png|100 px]] | |||
|[[File:AHGW 2D Cross Section Wizard dialog Step 3.png|100 px]] | |||
|[[File:AHGW Make Time Series Statistics dialog.png|60 px]] | |||
|[[File:AHGW Add to Raster Series dialog.png|100 px]] | |||
|[[File:AHGW Assign Related Identifier dialog.png|100 px]] | |||
|[[File:AHGW HGU Color Manager dialog.jpg|100 px]] | |||
|[[File:AHGW HGU Color Manager dialog color palette.jpg|100 px]] | |||
|- | |||
|[[File:AHGW Time Series Grapher Setup dialog.png|100 px]] | |||
| | |||
| | |||
| | |||
| | |||
| | | | ||
| | | | ||
| Line 236: | Line 375: | ||
|[[File:HY8Arch High Profile.JPG|thumb|100 px]] | |[[File:HY8Arch High Profile.JPG|thumb|100 px]] | ||
|[[File:HY8Arch Low Profile Table.JPG|thumb|100 px]] | |[[File:HY8Arch Low Profile Table.JPG|thumb|100 px]] | ||
|[[File:GSDA FlowRate v Time.png|thumb|100 px]] | |||
|[[File:ResidualVsObserved.png|thumb|100 px]] | |||
|- | |- | ||
|[[File:HY8User Defined Table.JPG|thumb|100 px]] | |[[File:HY8User Defined Table.JPG|thumb|100 px]] | ||
| Line 243: | Line 384: | ||
|[[File:Error.png|thumb|100 px]] | |[[File:Error.png|thumb|100 px]] | ||
|[[File:Weight.png|thumb|100 px]] | |[[File:Weight.png|thumb|100 px]] | ||
|[[File:GSDA Hydrograph ProvoRiver.png|thumb|100 px]] | |||
|[[File:ErrorVsSimulation.png|thumb|100 px]] | |||
|- | |- | ||
|[[File:Profileplot.png|thumb|100 px]] | |[[File:Profileplot.png|thumb|100 px]] | ||
| Line 248: | Line 391: | ||
|[[File:Mp3duTime.png|thumb|100 px]] | |[[File:Mp3duTime.png|thumb|100 px]] | ||
|[[File:Cppcoordsys3.jpg|thumb|100 px]] | |[[File:Cppcoordsys3.jpg|thumb|100 px]] | ||
| | |[[File:GNISTable.png|thumb|100 px]] | ||
| | |[[File:GSDA AndersonLandClassification.png|thumb|20 px]] | ||
|[[File:GSDA SNOTEL Report.png|thumb|70 px]] | |||
|[[File:Observeq1.jpg|thumb|70 px]] | |||
|- | |||
|[[File:GSDA FormatLandUse.png|thumb|100 px]] | |||
|[[File:GSDA SHPdirectory.png|thumb|100 px]] | |||
|[[File:GSDA TabulatedCSVdata.png|thumb|100 px]] | |||
|[[File:GSDA 60yearsGraph.png|thumb|100 px]] | |||
|[[File:GSDA YearGraph.png|thumb|100 px]] | |||
|[[File:GSDA Historical.png|thumb|100 px]] | |||
|[[File:Process 3D features from survey data.png|thumb|100 px]] | |||
|- | |||
|[[File:GSDA SnotelNarrative.png|thumb|70 px]] | |||
|[[File:GSDA UCCdata.png|thumb|100 px]] | |||
|[[File:GSDA UCCdata.png|thumb|100 px]] | |||
|[[File:GSDA StreamFlowGraph.png|thumb|100 px]] | |||
|[[File:GSDA USDA FlowChart.png|thumb|100 px]] | |||
|[[File:GSDA Graph Stream Stage.png|thumb|100 px]] | |||
|[[File:ComputedVsObserved.png|thumb|100 px]] | |||
|} | |} | ||
| Line 268: | Line 430: | ||
|[[File:3Dvisual.jpg|thumb|100 px]] | |[[File:3Dvisual.jpg|thumb|100 px]] | ||
|[[File:Manhole.jpg|thumb|100 px]] | |[[File:Manhole.jpg|thumb|100 px]] | ||
|[[File:3Dgeostat.jpg|thumb|100 px]] | |[[File:3Dgeostat.jpg|thumb|100 px]] | ||
|[[File:TethysUsersPage.png|thumb|100 px]] | |[[File:TethysUsersPage.png|thumb|100 px]] | ||
|[[File:BOUSS-2D Boundary Image.png|thumb|100 px]] | |[[File:BOUSS-2D Boundary Image.png|thumb|100 px]] | ||
|[[File:SMS LayoutQuick2.jpg|thumb|100 px]] | |[[File:SMS LayoutQuick2.jpg|thumb|100 px]] | ||
|[[File:ArcGIS - Arc Hydro Groundwater toolbar - Field drop-downs.png|thumb|100 px]] | |||
|- | |- | ||
|[[File:GsshaInterface.png|thumb|100 px]] | |[[File:GsshaInterface.png|thumb|100 px]] | ||
| Line 281: | Line 443: | ||
|[[File:X2coverage1.jpg|thumb|100 px]] | |[[File:X2coverage1.jpg|thumb|100 px]] | ||
|[[File:X2coverage2.jpg|thumb|100 px]] | |[[File:X2coverage2.jpg|thumb|100 px]] | ||
|- | |||
|[[File:GsshaStormDrainElevationInterpFig1.png|thumb|100 px]] | |||
|[[File:GsshaStormDrainAdverseSlopeFig1.png|thumb|100 px]] | |||
|[[File:GsshaStormDrainHydrographsFig3.png|thumb|100 px]] | |||
|[[File:AHGW Time Series example.png|thumb|100 px]] | |||
|[[File:AHGW MODFLOW Cell2D and Cell3D features example.jpg|thumb|100 px]] | |||
|[[File:AHGW BAS6 component used by the Build MODFLOW Cell3D tool.jpg|thumb|100 px]] | |||
|[[File:AHGW Basic tables for the BuildMODFLOW Cell3D tool.jpg|thumb|100 px]] | |||
|- | |||
|[[File:WMS Layout.jpg|thumb|100 px]] | |||
|[[File:Vector to scalar.PNG|thumb|100 px]] | |||
|[[File:GIS items in WMS.png|thumb|100 px]] | |||
|[[File:MODFLOW6-duplicate.png|thumb|100 px]] | |||
|[[File:MODFLOW6-runall.png|thumb|100 px]] | |||
|[[File:Scalar to vector toolbox.png|thumb|100 px]] | |||
|[[File:Whidbey Island showing Penn Cove and Admiralty Inlet.png|thumb|100 px]] | |||
|- | |||
|[[File:CreateBridgeFootprintExample6a.png|thumb|100 px]] | |||
|[[File:Clean.jpg|thumb| 100 px]] | |||
| | |||
| | |||
| | |||
| | |||
| | |||
|} | |} | ||
{|class="mw-collapsible mw-collapsed" style="width:1050px; border:1px solid #D0E0FF; margin-bottom:0.4em;" | {|class="mw-collapsible mw-collapsed" style="width:1050px; border:1px solid #D0E0FF; margin-bottom:0.4em;" | ||
| Line 308: | Line 494: | ||
|[[File:RationalStormDrainQuick.png|thumb|100 px]] | |[[File:RationalStormDrainQuick.png|thumb|100 px]] | ||
|[[File:Water waves.png|thumb|100 px]] | |[[File:Water waves.png|thumb|100 px]] | ||
| | |[[File:GsshaStormDrainRedistributeFig3.png|thumb|100 px]] | ||
| | |[[File:GsshaStormDrainRedistributeFig1.png|thumb|100 px]] | ||
|- | |||
|[[File:GSDACoordConvFig1.png|thumb|100 px]] | |||
|[[File:GSDACoordConvFig2.png|thumb|100 px]] | |||
|[[File:GSDA7.5Quad.png|thumb|100 px]] | |||
|[[File:GSDAObtainingDEMData.png|thumb|100 px]] | |||
|[[File:GSDADoylestownOut.png|thumb|100 px]] | |||
|[[File:GSDADoylestownIn.png|thumb|100 px]] | |||
|[[File:GSDAObtainingDOQData.png|thumb|100 px]] | |||
|} | |||
{|class="mw-collapsible mw-collapsed" style="width:1050px; border:1px solid #D0E0FF; margin-bottom:0.4em;" | |||
|- | |||
!style="text-align:left;"|Images Group 3 | |||
|- | |||
|[[File:GSDATerraServerSLC.png|thumb|100 px]] | |||
|[[File:GSDATerraServerDeltaCenter.png|thumb|100 px]] | |||
|[[File:GSDADraper7.5Quad.png|thumb|100 px]] | |||
|[[File:GSDAWharfDOQ.png|thumb|100 px]] | |||
|[[File:GSDA ZoomArea.png|thumb|100 px]] | |||
|[[File:GSDA ZoomTrack.png|thumb|100 px]] | |||
|[[File:GSDA ZoomWestBuildings.png|thumb|100 px]] | |||
|- | |||
|[[File:GSDA SelectionBox.png|thumb|100px]] | |||
|[[File:GSDA EPA LandUse.png|thumb|100px]] | |||
|[[File:GSDA EPA Soil Type.png|thumb|100px]] | |||
|[[File:GSDA Land Use.png|thumb|100px]] | |||
|[[File:GSDA NRCS STATSGO Soil Type.png|thumb|100px]] | |||
|[[File:GSDA PrecipitationPRISM.png|thumb|100px]] | |||
|[[File:GSDA PrecipitationNRCS.png|thumb|100px]] | |||
|- | |||
|[[File:GSDA ThiessenWatershed.png|thumb|100 px]] | |||
|[[File:GSDA PrecipitationNOAA.png|thumb|100 px]] | |||
|[[File:GSDA UCCmaps.png|thumb|100 px]] | |||
|[[File:Utah's precipitation map.png|thumb|100 px]] | |||
|[[File:GSDA UtahArcView.png|thumb|100 px]] | |||
|[[File:GSDA USDA-NRCS Alaska.png|thumb|100 px]] | |||
|[[File:GSDA USDA-NRCS SnowCover.png|thumb|100 px]] | |||
|- | |||
|[[File:GSDA USDA April2000.png|thumb|100px]] | |||
|[[File:GSDA ESRI1995.png|thumb|100px]] | |||
|[[File:GSDA CatalogingUnits.png|thumb|100px]] | |||
|[[File:GSDA EPA NHD StreamNetwork.png|thumb|100px]] | |||
|[[File:SchematicDisplayByValue.png|thumb|50 px]] | |||
|[[File:PruneArcDirection.png|thumb|100 px]] | |||
|[[File:CreateBridgeFootprintExample6b.png|thumb|100 px]] | |||
|} | |} | ||
| Line 317: | Line 547: | ||
*[[File:DMI XML File.zip]] | *[[File:DMI XML File.zip]] | ||
*[[File:OmegaEM.zip]] | *[[File:OmegaEM.zip]] | ||
*[[File:Tip landuse lu codes.zip]] | |||
[[Category:Archived]] | [[Category:Archived]] | ||
[[Category:Jcreer|Archived]] | [[Category:Jcreer|Archived]] | ||
Latest revision as of 14:40, 16 July 2024
This page shows images that are not being used, but may still have value. Images that are not being used and are not likely to be used in the future have been or will be deleted.
If an image on this page is being used in another wiki article, removed the image from this page.
Icons, Logos, and Headers
| Files for icons and logos | |||||||||||||||||||
|---|---|---|---|---|---|---|---|---|---|---|---|---|---|---|---|---|---|---|---|

|

|
||||||
Dialogs
| Dialog images Group 1 | |||||
|---|---|---|---|---|---|
| Dialog images Group 2 | ||||||
|---|---|---|---|---|---|---|
| Dialog images Group 3 | ||||||
|---|---|---|---|---|---|---|
AHGW Dialogs
| AHGW Dialog images | |||||||
|---|---|---|---|---|---|---|---|

|

|

|

|
|
|

| |
|

|

|

|

|

|

|
|

|

|

|

|

|

|

| |

|
Graphs, Tables, and Equations
General Images
| Images Group 1 | ||||||
|---|---|---|---|---|---|---|
| Images Group 2 | ||||||
|---|---|---|---|---|---|---|
| Images Group 3 | ||||||
|---|---|---|---|---|---|---|


