HY8:LOWFLOW SS Results Table: Difference between revisions
(Created page with "=Low Flow Hydraulics, Results Table= 800 px The purpose of this dialog is to report to the user most of variables used in the computations to v...") |
No edit summary |
||
| Line 1: | Line 1: | ||
=Low Flow Hydraulics, Results Table= | =Low Flow Hydraulics, Results Table= | ||
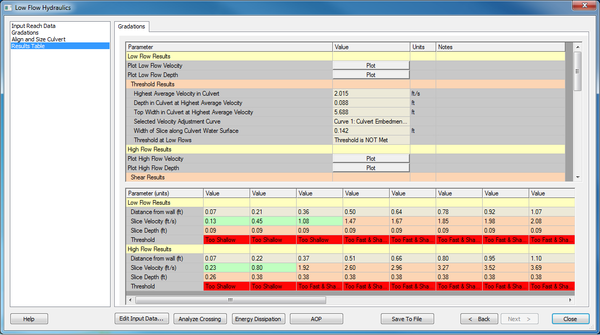
[[Image:LowFlowResults.jpg | | [[Image:LowFlowResults.jpg |thumb|600 px|''Low Flow Hydraulics'' dialog show the ''Results Table'' options.]] | ||
The purpose of this dialog is to report to the user most of variables used in the computations to verify that the results and process are reasonable. | The purpose of this dialog is to report to the user most of variables used in the computations to verify that the results and process are reasonable. | ||
Revision as of 14:32, 28 April 2015
Low Flow Hydraulics, Results Table
The purpose of this dialog is to report to the user most of variables used in the computations to verify that the results and process are reasonable.
Results Table
Culvert Results (First Spreadsheet)
The user can plot the velocity and depth across half of the span of the culvert (from the wall to the center) for the low and high flows by clicking the buttons below the respective flow heading. The threshold results are then given displaying the highest average velocity, the depth at that location, the top width, the velocity adjustment curve that was selected, the width of the slices, and whether the threshold is ever satisfied.
If a gradation is included, the table also includes shear results. The equations used to perform these calculations are available in HEC-26 Chapter 7. It reports the energy slope used, the D50 of the gradation used, the v*, Reynold's value, and Shield's value for the shear calculations and the resulting shear computations.
The threshold inputs are also included at the bottom of the table.
Slice Results (Second Spreadsheet)
The results from each slice are given, with each column representing one slice. The leftmost column is the slice closest to the wall and the rightmost column is the slice closest to the center. The first result is the distance from the well to the center of the slice. Then the velocity is reported. If it is below the threshold velocity, it is given a light green background while it is light red if it exceeds the threshold velocity. The depth is reported next, and if it is deeper than the threshold velocity, it is given a light green background and a light red one if is more shallow than the threshold depth. The final row is the combined threshold result given a green background if both thresholds are met in the slice or a red background if it failed for either reason.
