Lidar Support: Difference between revisions
| Line 42: | Line 42: | ||
==General Options== | ==General Options== | ||
In addition to filtering out point classifications, XMS supports the following options: | In addition to filtering out point classifications, XMS supports the following options: | ||
* | * Use Previous Mode Load 1 in N Points (user specifies N) | ||
* Delete samples over N standard deviations from the mean (user specifies N) | * Delete samples over N standard deviations from the mean (user specifies N) | ||
* Swap elevations (multiply by -1) | * Swap elevations (multiply by -1) | ||
Revision as of 14:39, 22 March 2017
The term LIDAR refers to a technology known as LIght Detection And Ranging. This technology is used to gather a large amount of survey data from fixed wing aircraft or helicopters as they fly over the survey region. The technique has the ability to penetrate clear water up to a limited depth (maybe up to 20 meters but varies based on conditions).
A LIDAR file (normally it has an extension of ".las" or ".laz") is a survey file that includes data points gathered from a LIDAR system and processed.
Importing a LIDAR File
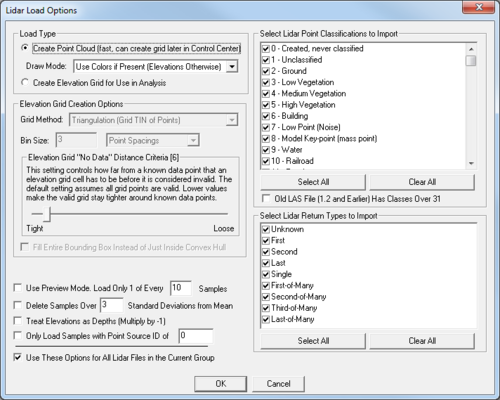
When a lidar is read in, XMS uses the Global Mapper library. The Lidar Load Options dialog appears to allow the user to specify importing options. Principally, the user specifies whether the data should be loaded as a raster or scatter. Then create a raster or scatter set. This dialog is actually a component of the Global Mapper library. Therefore, the options in the dialog are described as a point cloud (scatter set) or a grid (raster).
This dialog also lists all the data sources/types of data included in the file and allows the user to select which data types should be imported.
Reading as a point cloud (scatter set)
If the user selects point cloud, SMS creates both a scatter set and an image. Note that because this is not a uniformly arranged set of data and thus not a raster, all of the raster editing options will be unavailable for this data. There are several options for the appearance of the image. These include:
- Use Colors if Present (Elevations Otherwise) – The points in the LIDAR set are given a color. This appears like a contour plot image.
- Color Elevations Using Current Shader – currently SMS does not allow the user to select shader options, so this option also appears as a contour plot image.
- Color by intensity – this results in a gray scale image.
- Color by classification – the points in the LIDAR set are colored based on their type. This can be useful to see what types of data (layers) exist in the file. If all the points in a file are the same type, the image is a single color.
- Color by random number – colored points – no documentation is available for this feature
The scatter points created when reading a LIDAR file are not triangulated. They must be triangulated to extract observation profiles or use them as source of bathymetry.
Reading as an elevation grid (raster)
If the user selects grid, XMS creates a raster and an image. XMS adds the raster as a VTK raster and the image as an image. The image appears as a hillshade.
This option is much slower than the point cloud option.
Options include:
- Elevation Grid creation Options – Tight to Loose
- Loose (default) – for a test case it created 63752617 points/cells
- Medium – for test case it created 63714287 points/cells with some holes
- Tight – for test case it created 15058938 points that are mostly disjoint
- If the LIDAR data is not a box, SMS can fill either the entire box or just the convex hull with gridded data.
Holes left in the grid are also reflected as holes in the image. The tighter the option, the slower the process appears to be.
LIDAR Images
Reading a LIDAR file always results in an image in XMS. For some images, XMS allows the conversion to a RASTER. Since that option is available when reading the LIDAR file, this capability is not available for images created as a side effect of reading a LIDAR file.
General Options
In addition to filtering out point classifications, XMS supports the following options:
- Use Previous Mode Load 1 in N Points (user specifies N)
- Delete samples over N standard deviations from the mean (user specifies N)
- Swap elevations (multiply by -1)
Related Topics
SMS – Surface-water Modeling System | ||
|---|---|---|
| Modules: | 1D Grid • Cartesian Grid • Curvilinear Grid • GIS • Map • Mesh • Particle • Quadtree • Raster • Scatter • UGrid |  |
| General Models: | 3D Structure • FVCOM • Generic • PTM | |
| Coastal Models: | ADCIRC • BOUSS-2D • CGWAVE • CMS-Flow • CMS-Wave • GenCade • STWAVE • WAM | |
| Riverine/Estuarine Models: | AdH • HEC-RAS • HYDRO AS-2D • RMA2 • RMA4 • SRH-2D • TUFLOW • TUFLOW FV | |
| Aquaveo • SMS Tutorials • SMS Workflows | ||
