SMS:BOUSS-2D Probes: Difference between revisions
| (10 intermediate revisions by the same user not shown) | |||
| Line 1: | Line 1: | ||
[[Image:Probe manager.png|thumb|600 px|''BOUSS-2D Probe Manager'' dialog]] | [[Image:Probe manager.png|thumb|600 px|''BOUSS-2D Probe Manager'' dialog]] | ||
BOUSS-2D can output the histories of the computed water surface elevation, velocities, force, and pressure at every grid point and at every time step. However, due to the number of data points in the domain, this is usually done at intervals of 15 | BOUSS-2D can output the histories of the computed water surface elevation, velocities, force, and pressure at every grid point and at every time step. However, due to the number of data points in the domain, this is usually done at intervals of 15–30 min. | ||
In order to provide a more complete temporal representation of the results of the calculation, the model allows specifying probes. At a probe location (x,y,z), specify what data should be saved and at what temporal resolutions. The options include water surface, velocity, force, and pressure. | In order to provide a more complete temporal representation of the results of the calculation, the model allows specifying probes. At a probe location (x,y,z), specify what data should be saved and at what temporal resolutions. The options include water surface, velocity, force, and pressure. | ||
==BOUSS-2D Probe Manager== | ==BOUSS-2D Probe Manager== | ||
[[File:BOUSS-PressureProbeOptions. | [[File:BOUSS-PressureProbeOptions.png|thumb|230 px|Example of the BOUSS-2D ''Pressure Probe Options'' dialog. The ''UV Probe Options'' dialog is similar.]] | ||
The probe manager allows creating, editing, and deleting probes. This dialog is only accessible when a BOUSS-2D grid exists. The properties associated with probes as follows: | The probe manager allows creating, editing, and deleting probes. This dialog is only accessible when a BOUSS-2D grid exists. The properties associated with probes as follows: | ||
* ''*.ts1 solution data loaded'' – Indicates the highlight color for any fields that have solution data loaded. | * ''*.ts1 solution data loaded'' – Indicates the highlight color for any fields that have solution data loaded. | ||
| Line 23: | Line 23: | ||
A probe can be deleted from the ''Probe Manager'' list by selecting the probe row number and hitting the ''Delete'' key. | A probe can be deleted from the ''Probe Manager'' list by selecting the probe row number and hitting the ''Delete'' key. | ||
==Viewing Probe Solutions== | ==Viewing Probe Solutions== | ||
After running the BOUSS-2D model, [[SMS:BOUSS-2D Files#Output Files|probe solution files]] are generated. These files can be imported into SMS to view the probe data. Right-clicking on a probe cell will have the following options for viewing probe data: | After running the BOUSS-2D model, [[SMS:BOUSS-2D Files#Output Files|probe solution files]] are generated. These files can be imported into SMS to view the probe data. Right-clicking on a probe cell will have the following options for viewing probe data: | ||
* '''Eta Time Series Plot''' – Creates an eta time series plot. | * '''Eta Time Series Plot''' – Creates an eta time series plot. | ||
* '''Basic Statistical Analysis''' – Brings up a '' | * '''Pressure Time Series Plot''' – Creates a pressure time series plot. | ||
* '''U Time Series Plot''' – Creates a U time series plot. | |||
* '''V Time Series Plot''' – Creates a V time series plot. | |||
* '''Basic Statistical Analysis''' – Brings up a ''Basic Statistical Analysis'' dialog. | |||
* '''Zero-crossing Analysis''' – Brings up a ''Zero-crossing Analysis'' dialog. | * '''Zero-crossing Analysis''' – Brings up a ''Zero-crossing Analysis'' dialog. | ||
* '''Spectral Analysis''' – Brings up a ''Spectral Analysis'' dialog showing a spectral plot. | * '''Spectral Analysis''' – Brings up a ''Spectral Analysis'' dialog showing a spectral plot. | ||
===Basic Statistical Analysis=== | |||
[[File:BOUSS2D BasicStatsAnalysis.png|thumb|450 px|Example of the BOUSS-2D ''Eta Basic Statistical Analysis'' dialog]] | |||
The ''Basic Statistical Analysis'' dialog includes the following information for each probe: | |||
* ''Mean (m)'' | |||
* ''Minumum (m)'' | |||
* ''Maximum (m)'' | |||
* ''Standard Deviation (m)'' | |||
===Zero-crossing Analysis=== | ===Zero-crossing Analysis=== | ||
The ''Zero-crossing Analysis'' dialog contains the following information for each probe: | |||
The ''Zero-crossing Analysis'' dialog contains the following information: | |||
* ''HAV (m)'' – Average wavelength for the full time series. | * ''HAV (m)'' – Average wavelength for the full time series. | ||
* ''H13 (m)'' – Average of the highest 3% of Water Surface Elevation. | * ''H13 (m)'' – Average of the highest 3% of Water Surface Elevation. | ||
| Line 39: | Line 50: | ||
* ''T13 (s)'' – Average of the highest 3% of time periods. | * ''T13 (s)'' – Average of the highest 3% of time periods. | ||
* ''T110 (s)'' – Average of the highest 10% of time periods. | * ''T110 (s)'' – Average of the highest 10% of time periods. | ||
[[File:BOUSS2D Zero-crossingAnalysis.png|thumb|none|450 px|The BOUSS-2D ''Zero-crossing Analysis'' dialog]] | |||
==Related Topics== | ==Related Topics== | ||
| Line 47: | Line 59: | ||
{{Template:Navbox SMS}} | {{Template:Navbox SMS}} | ||
[[Category:BOUSS-2D|P]] | [[Category:BOUSS-2D|P]] | ||
[[Category:BOUSS-2D Dialogs]] | [[Category:BOUSS-2D Dialogs|Pro]] | ||
[[Category:Runup/Overtopping]] | [[Category:Runup/Overtopping|Pro]] | ||
[[Category:Runup/Overtopping Dialogs]] | [[Category:Runup/Overtopping Dialogs|Pro]] | ||
Latest revision as of 22:21, 22 July 2019
BOUSS-2D can output the histories of the computed water surface elevation, velocities, force, and pressure at every grid point and at every time step. However, due to the number of data points in the domain, this is usually done at intervals of 15–30 min.
In order to provide a more complete temporal representation of the results of the calculation, the model allows specifying probes. At a probe location (x,y,z), specify what data should be saved and at what temporal resolutions. The options include water surface, velocity, force, and pressure.
BOUSS-2D Probe Manager
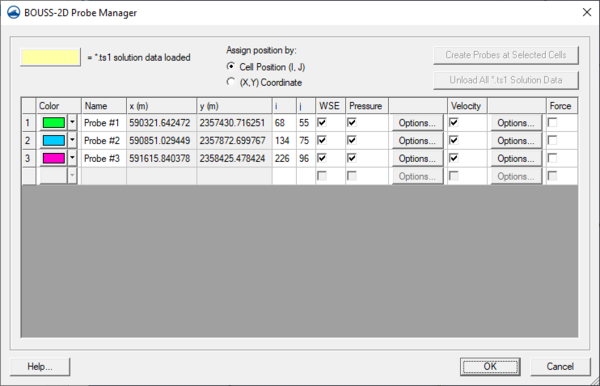
The probe manager allows creating, editing, and deleting probes. This dialog is only accessible when a BOUSS-2D grid exists. The properties associated with probes as follows:
- *.ts1 solution data loaded – Indicates the highlight color for any fields that have solution data loaded.
- Create Probes at Selected Cells – This button will add probes to the probe list using any cells that were selected when the Probe Manager was opened.
- Unload All *.ts1 Solution Data – If any *.ts1 solution data has been loaded for any of the probe properties, the fields with that data will be highlighted. Clicking this button will unload the the solution data, allowing a new solution file to be generated when BOUSS-2D is run again.
- Asign position by: – These options will determine which coordinate fields to use in positioning the probes.
- Cell Position (I,J) – Activates the i and j fields.
- (X,Y) Coordinate – Activates the x and y fields.
- Color – Clicking on this button will bring up Color dialog. Altenatively, a simple color picker can be accessed by clicking on the arrow to the right.
- Name – A default name will be entered in this field, but by selecting the field any name can be typed in.
- x and y coordinates – These fields are only available when the (X,Y) Coordinate option is toggled on under the Assign position by: section. When active, specific coordinates may be entered which will move the probe on the grid.
- i and j coordinates – These fields are only available when the Cell Position (I,J) option is toggled on under the Assign position by: section. When active, specific coordinates may be entered which will move the probe on the grid.
- WSE – When checked, specifies using available water surface elevation data.
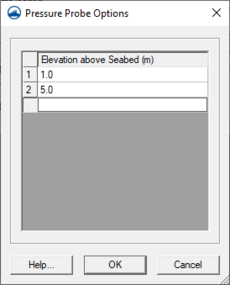
- Pressure – When checked, specifies using available wpressure data. The Options button will bring up the Pressure Probe Options dialog where elevation data can be entered.
- Velocity – When checked, specifies using available velocity data. The Options button will bring up the UV Probe Options dialog where elevation data can be entered.
- Force – When checked, specifies using available force data.
A probe can be deleted from the Probe Manager list by selecting the probe row number and hitting the Delete key.
Viewing Probe Solutions
After running the BOUSS-2D model, probe solution files are generated. These files can be imported into SMS to view the probe data. Right-clicking on a probe cell will have the following options for viewing probe data:
- Eta Time Series Plot – Creates an eta time series plot.
- Pressure Time Series Plot – Creates a pressure time series plot.
- U Time Series Plot – Creates a U time series plot.
- V Time Series Plot – Creates a V time series plot.
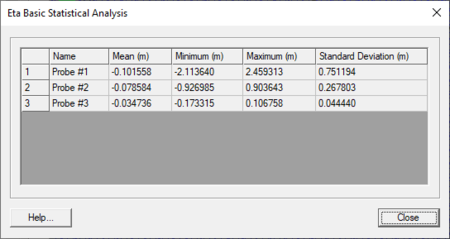
- Basic Statistical Analysis – Brings up a Basic Statistical Analysis dialog.
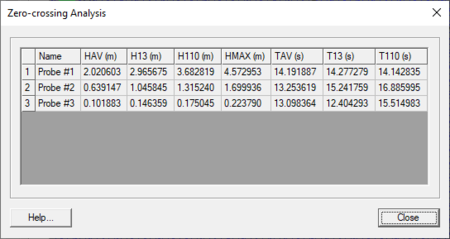
- Zero-crossing Analysis – Brings up a Zero-crossing Analysis dialog.
- Spectral Analysis – Brings up a Spectral Analysis dialog showing a spectral plot.
Basic Statistical Analysis
The Basic Statistical Analysis dialog includes the following information for each probe:
- Mean (m)
- Minumum (m)
- Maximum (m)
- Standard Deviation (m)
Zero-crossing Analysis
The Zero-crossing Analysis dialog contains the following information for each probe:
- HAV (m) – Average wavelength for the full time series.
- H13 (m) – Average of the highest 3% of Water Surface Elevation.
- H110 (m) – Average of the highest 10% of Water Surface Elevation.
- HMAX (m) – Highest Water Surface Elevation.
- TAV (s) – Average time periods for the full time series.
- T13 (s) – Average of the highest 3% of time periods.
- T110 (s) – Average of the highest 10% of time periods.
Related Topics
SMS – Surface-water Modeling System | ||
|---|---|---|
| Modules: | 1D Grid • Cartesian Grid • Curvilinear Grid • GIS • Map • Mesh • Particle • Quadtree • Raster • Scatter • UGrid |  |
| General Models: | 3D Structure • FVCOM • Generic • PTM | |
| Coastal Models: | ADCIRC • BOUSS-2D • CGWAVE • CMS-Flow • CMS-Wave • GenCade • STWAVE • WAM | |
| Riverine/Estuarine Models: | AdH • HEC-RAS • HYDRO AS-2D • RMA2 • RMA4 • SRH-2D • TUFLOW • TUFLOW FV | |
| Aquaveo • SMS Tutorials • SMS Workflows | ||


