GMS:2D Mesh Display Options: Difference between revisions
From XMS Wiki
Jump to navigationJump to search
No edit summary |
No edit summary |
||
| (One intermediate revision by the same user not shown) | |||
| Line 10: | Line 10: | ||
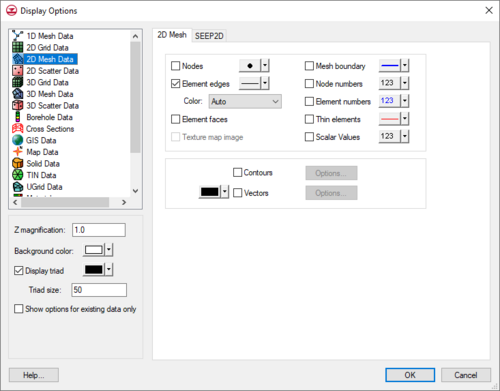
The color of the element edges can be adjusted according to the following options: | The color of the element edges can be adjusted according to the following options: | ||
# Auto – | # Auto – Draws the [[GMS:Materials|material]] color if faces are not displayed. Draws the color displayed next to ''Element Edges'' if the faces are displayed. | ||
# Specified – | # Specified – Uses the color specified next to ''Element edges''. | ||
# Material – | # Material – Displays the material color of the cell. | ||
|- | |- | ||
| Element faces || This option fills the elements with the material color. | | Element faces || This option fills the elements with the material color. | ||
| Line 24: | Line 24: | ||
| Element numbers || Displays the ID associated with each element at the centroid of the element. | | Element numbers || Displays the ID associated with each element at the centroid of the element. | ||
|- | |- | ||
| Thin elements || | | Thin elements || Highlights triangular elements with small aspect ratios. The minimum aspect ratio can be set using the [[GMS: 2D Mesh Settings#Thin_Triangle_Aspect_Ratio|''Thin triangles aspect ratio'']] option in the [[GMS: 2D Mesh Settings|2D mesh ''Preferences'']] dialog. | ||
|- | |- | ||
| Scalar values || Displays the scalar values of the active dataset for each node next to the node. | | Scalar values || Displays the scalar values of the active dataset for each node next to the node. | ||
|- | |- | ||
| Contours || Most of the objects supported by GMS can be contoured by turning on the [[GMS:Contour Options|''Contours'' option]] in the ''Display Options'' dialog. When an object is contoured, the values associated with the active dataset for the object are used to generate the contours. | | Contours || Most of the objects supported by GMS can be contoured by turning on the [[GMS:Contour Options|''Contours'' option]] in the ''Display Options'' dialog. When an object is contoured, the values associated with the active dataset for the object are used to generate the contours. | ||
|- Vectors || If the [[GMS:Vectors|Vectors]] item in the ''Display Options'' dialog is selected for an object (TIN, Grid, or Mesh), vector plots can be generated using the active vector dataset for the object. One vector is placed at each node, cell, or vertex. | |- | ||
| Vectors || If the [[GMS:Vectors|Vectors]] item in the ''Display Options'' dialog is selected for an object (TIN, Grid, or Mesh), vector plots can be generated using the active vector dataset for the object. One vector is placed at each node, cell, or vertex. | |||
|} | |} | ||

