User:Jcreer/SMS:SRH-2D Floodway Tools: Difference between revisions
| (3 intermediate revisions by the same user not shown) | |||
| Line 64: | Line 64: | ||
|} | |} | ||
{{Wide image|CompareFloodwaySimulationDataTable.png| | {{Wide image|CompareFloodwaySimulationDataTable.png|none|''Compare Floodway Simulation Data'' dialog results table|800|right|alt=Compare Floodway Simulation Data'' dialog results table|}} | ||
{{-}} | {{-}} | ||
Latest revision as of 19:39, 30 July 2021
The SRH-2D floodway tools allow generating floodway simulations and evaluating the generated simulation.
Generate Floodway Simulation
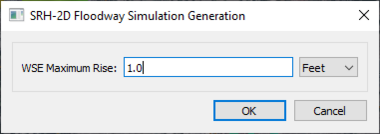
The Generate Floodway Simulation tool creates a new SHR-2D simulation for evaluating a floodway. The tool is accessed using the SRH-2D simulation right-click menu selecting the Floodway Tools | Generate Floodway Simulations command. The tool will bring up the SRH-2D Floodway Simulation Generation dialog. The dialog has the following options:
- WSE Maximum Rise – The maximum rise for the water surface elevation in the floodway simulation. This value should be positive.
- Units – Set the units for the WSE maximum rise. The units should match the project units.
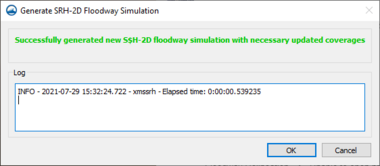
After completing the SRH-2D Floodway Simulation Generation dialog and clicking OK, the Generate SRH-2D Floodway Simulation dialog will appear showing the progress for the generation of the floodway simulation. If there are errors during the generation process, they will appear in this dialog. When the generation process proceeds successfully, a message will appear.
Generate Floodway Elevation Lines
The Generate Floodway Evaluation Lines tool will create a new Area Property coverage with arcs that can be used for evaluating floodway elevations. The generated arcs will have an assigned elevation using a water surface elevation dataset. These arcs can then be compared to floodway data. Specifically, this can be used to create a summary table comparing the floodplain water levels and speeds to the floodway water levels and speeds.
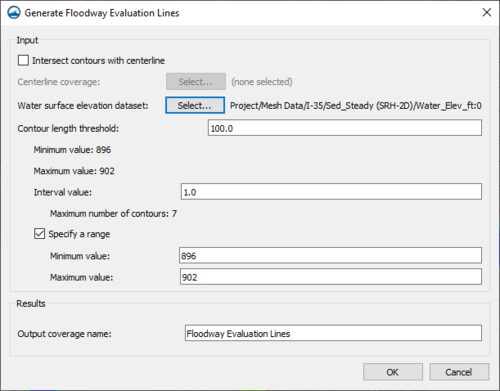
The tool is accessed using the SRH-2D simulation right-click menu selecting the Floodway Tools | Generate Floodway Evaluation Lines command. The tool will bring up the Generate Floodway Evaluation Lines dialog. The dialog has the following options:
Input – This section defines the parameters that will be used when generating the evaluation lines.
- Intersect contours with centerline – Turn on this option so that all of the generate evaluation lines intersect a chosen centerline.
- Centerline Coverage – Clicking the Select button next to this option will bring up the Select Centerline Coverage dialog where a centerline can be selected to use during the evaluation line generation.
- Water surface elevation dataset – Clicking the Select button next to this option will bring up the Select WSE Dataset dialog where the water surface elevation dataset can be selected to use in the evaluation line generation. This dataset will determine the elevation of the evaluation lines. For transient datasets, a time step can be selected.
- Contour length threshhold – Sets a threshold for length of the contours in the WSE dataset used to generate the evaluation lines.
- Minimum value – The minimum length value of the contours based on the selected WSE dataset.
- Maximum value – The maximum length value of the contours based on the selected WSE dataset.
- Interval value – The interval of the elevation values to use in determining the contour lines.
- Maximum number of contours – The number of contour lines that will be generated from the WSE dataset based on the entered interval.
- Specify a range – Turn on this option to adjust the minimum and maximum contour lengths.
- Minimum value – Set the minimum length value of the contours based on the selected WSE dataset.
- Maximum value – Set the maximum length value of the contours based on the selected WSE dataset.
- Contour length threshhold – Sets a threshold for length of the contours in the WSE dataset used to generate the evaluation lines.
Results – This section provides parameters for the results of generating the evaluation lines.
- Output coverage name – Enter a name for the coverage that will hold the evaluation lines.
Compare Floodway Simulation Data
The Compare Floodway Simulation Data generates a table comparing the floodway simulation to the base floodplain simulation.
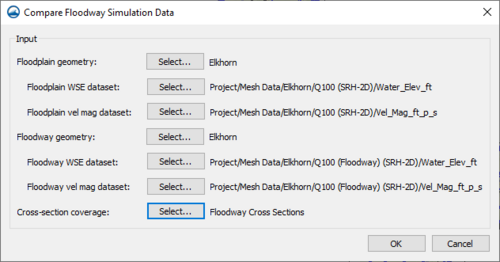
The tool is accessed using the SRH-2D simulation right-click menu selecting the Floodway Tools | Compare Floodway Simulation Data command. The tool will bring up the Compare Floodway Simulation Data dialog. The dialog has the following options:
- Floodplain geometry – Clicking the Select button next to this option will bring up the Select Floodplain Geometry dialog where a the floodplain geometry (mesh, UGrid, etc.) used in the original simulation should be selected.
- Floodplain WSE dataset – Clicking the Select button next to this option will bring up the Select WSE Dataset dialog where a the water surface dataset in the original simulation should be selected.
- Floodplain vel mag dataset – Clicking the Select button next to this option will bring up the Select Velocity Magnitude Dataset dialog where a the velocity magnitude dataset in the original simulation should be selected.
- Floodway geometry – Clicking the Select button next to this option will bring up the Select Floodway Geometry dialog where a the floodway geometry (mesh, UGrid, etc.) used in the floodway simulation should be selected.
- Floodway WSE dataset – Clicking the Select button next to this option will bring up the Select WSE Dataset dialog where a the water surface dataset in the floodway simulation should be selected.
- Floodway vel mag dataset – Clicking the Select button next to this option will bring up the Select Velocity Magnitude Dataset dialog where a the velocity magnitude dataset in the floodway simulation should be selected.
- Cross-section coverage – Clicking the Select button next to this option will bring up the Select Cross Section Coverage dialog where a the map coverage containing the evaluation lines can be selected.
The Compare Floodway Simulation Data table that is generated will show the following values:
|
|
Related Topics
SMS – Surface-water Modeling System | ||
|---|---|---|
| Modules: | 1D Grid • Cartesian Grid • Curvilinear Grid • GIS • Map • Mesh • Particle • Quadtree • Raster • Scatter • UGrid |  |
| General Models: | 3D Structure • FVCOM • Generic • PTM | |
| Coastal Models: | ADCIRC • BOUSS-2D • CGWAVE • CMS-Flow • CMS-Wave • GenCade • STWAVE • WAM | |
| Riverine/Estuarine Models: | AdH • HEC-RAS • HYDRO AS-2D • RMA2 • RMA4 • SRH-2D • TUFLOW • TUFLOW FV | |
| Aquaveo • SMS Tutorials • SMS Workflows | ||


