SMS:ARR Mesh Quality Assessment Plot: Difference between revisions
No edit summary |
|||
| (25 intermediate revisions by 5 users not shown) | |||
| Line 1: | Line 1: | ||
The Angle Representation Region (ARR) plot is used to assess the overall quality of a triangular mesh such as those used by ADH, ADCIRC and other numerical engines. When the plot wizard is selected, this option appears if the mesh module is enabled. Clicking finish in the [[SMS:Plot | The ''Angle Representation Region (ARR)'' plot is used to assess the overall quality of a triangular mesh such as those used by ADH, ADCIRC and other numerical engines. When the plot wizard is selected, this option appears if the mesh module is enabled. Clicking finish in the [[SMS:Plot_Window#Plot_Wizard|''Plot Wizard'']] results in an ARR plot for the current unstructured mesh, loaded in SMS. | ||
The plot includes the ARR region | The plot includes the ARR region, a point for each of the lowest quality elements in the mesh (the number of points included has varied from one version of SMS to another and is currently at 200), and three contour lines (0.3 in red, 0.45 in yellow and 0.6 in green) of the currently selected element quality measure. As a general rule, elements with quality lower than 0.3 should be reviewed and improved ([[SMS:Mesh Module#Editing a Mesh|mesh editing]]) if possible. | ||
Click on any point in the plot to see the element ID associated with that point and the six quality measure values for that element. | |||
Once the mesh is edited in any way, | Once the mesh is edited in any way, update the ARR plot by right-clicking in the plot and selecting '''Refresh'''. Until this is done, the plot will continue to reflect the mesh that existed when it was generated, or most recently refreshed. | ||
This plot is based on a the | This plot is based on a paper entitled "Numerical representation of the quality measures of triangles and triangular meshes".<ref>Sarrate, J. , Palau, J. and Huerta, A. (2003), Numerical representation of the quality measures of triangles and triangular meshes. ''Communications in Numerical Methods in Engineering''., 19: 551-561.[https://upcommons.upc.edu/bitstream/handle/2117/8472/2003-CNME-SPH-blanc.pdf]</ref> Several of the figures below are derived from this paper. | ||
To assess the quality of a triangular mesh, such as those used by ADH or ADCIRC, the quality of each element is represented as a point | To assess the quality of a triangular mesh, such as those used by ADH or ADCIRC, the quality of each element is represented as a point based on the interior angles of that element. These interior angles are labeled ''α'', ''β'', and ''γ'' as shown: | ||
[[File:elem_angles.png]] | :[[File:elem_angles.png]] | ||
Plot these three angles into an equilateral triangle. | |||
[[File:BaryDomain.png]] | :[[File:BaryDomain.png]] | ||
If | If ordering the three angles so that ''α > β > γ'' as shown below, all of the points will fall into the shaded portion of the equilateral triangle. This is referred to as the ARR region. | ||
[[File:elem_angles_ordered.png]] | {| | ||
|- | |||
|[[File:elem_angles_ordered.png|thumb|none|Angels ordered so that ''α > β > γ'']] | |||
|[[File:ARRdomain.png|thumb|none|The ARR region]] | |||
[[File:ARRdomain.png]] | |} | ||
The quality of the elements is further assessed by computing a quality measure from attributes of the triangle. These attributes include: | The quality of the elements is further assessed by computing a quality measure from attributes of the triangle. These attributes include: | ||
*The minimum interior angle α<sub>min</sub>(γ | *The minimum interior angle ''α<sub>min</sub>''(''γ'' from previous figure). | ||
*The lengths of edges | *The lengths of edges | ||
*The triangle area | *The triangle area | ||
*The inner and outer radius | *The inner and outer radius | ||
*The minimum distance through the triangle (h<sub>min</sub>) | *The minimum distance through the triangle (''h<sub>min</sub>'') | ||
These measures vary from 0.0 at the edges of the equilateral triangle to 1.0 at the center. The measures supported by SMS include: | These measures vary from 0.0 at the edges of the equilateral triangle to 1.0 at the center. The measures supported by SMS include: | ||
<math>q_{ | :<math>q_{a_{min}} = \frac {3a_{min}}{\pi} ,\ q_{Ll} = \frac {l_{min}}{l_{max}} ,\ q_{ALS} = \cfrac {4\sqrt{3}A}{l\frac {2}{1}+l\frac {2}{2}+l\frac {2}{3}} </math> | ||
<math>q_{Rr} = \frac {2r}{R} ,\ q_{Lr} = \frac {2\sqrt{3}r}{l_{max}} ,\ q_{Lh} = \frac {2h_{min}}{\sqrt{3}l_{max}} </math> | :<math>q_{Rr} = \frac {2r}{R} ,\ q_{Lr} = \frac {2\sqrt{3}r}{l_{max}} ,\ q_{Lh} = \frac {2h_{min}}{\sqrt{3}l_{max}} </math> | ||
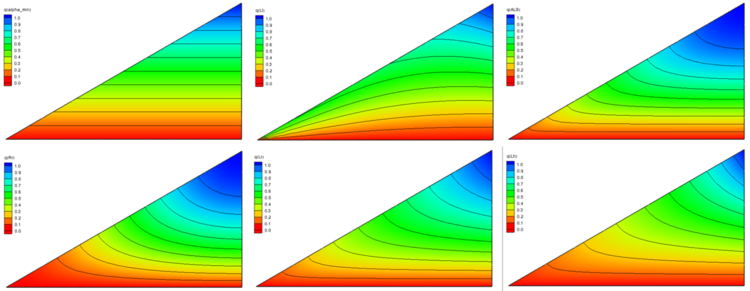
The following figures show how each of these quality measures cover the ARR | The following figures show how each of these quality measures cover the ARR | ||
[[File:Contours.png|750 px]] | :[[File:Contours.png|750 px]] | ||
==Right-Click Options== | |||
Right-click on the ARR mesh quality assessment plot will some options for viewing the plot. These options include: | |||
*'''Alpha-min Quality Measure''' | |||
*'''ALS Quality Measure''' | |||
*'''Rr Quality Measure''' | |||
*'''Lr Quality Measure''' | |||
*'''Lh quality Measure''' | |||
==Observation Profile Troubleshooting== | |||
If a plot will not generate or does not display significant data, it's possible that the conditions for the plot have not been set up correctly. To get a meaningful plot, take the following into account: | |||
* This plot requires a mesh. | |||
* If there are multiples meshes, make sure the correct mesh is active in the Project Explorer to get the desired data. If the correct mesh is active in the Project Explorer, and the plot still doesn't seem to represent the mesh accurately, then try right-clicking in the plot window and using the '''Refresh Plot''' command. This redraws the plot to represent the most recent information from SMS. | |||
* Refreshing the plot is also useful if the mesh was recently edited. The plot will refresh to show the most recent results for the active mesh. | |||
* This plot will only represent the quality of the triangular elements of a mesh. If there are both quadrilaterals and triangles in a mesh, then it does not necessarily accurately represent the overall quality of the mesh. | |||
==ARR Applied to Quadrilaterals== | |||
It should be noted that meshes that include quadrilateral elements do not match the theory of the ARR plot methodology as defined in the associated publications. Since ARR was derived to apply to triangular meshes, the SMS development team modified the approach to apply in some way to quadrilateral elements. It should be noted that the approach for quadrilaterals in SMS 13.1 and before was deemed to be inconsistent and was therefore modified in version 13.2 and newer. The original approach tended to ignore quadrilateral elements or give them a higher quality rating than similar triangular elements. Therefore, an ARR plot for a mesh containing quadrilaterals that was dominated by triangular elements in version 13.1 and earlier, may be dominated by quadrilateral elements in version 13.2 and later. If a uniform comparison is desired, it is suggested that the mesh which contains quadrilateral elements be duplicated and all the quads split into triangles. | |||
Originally, the application of quadrilateral elements to the ARR plot used the same interior angle limits that are applied to triangles. This ignores the fact that an ideal triangular element consists of an equilateral triangle, while an ideal quadrilateral element consists of a square. Using only the internal angle measures for the quadrilateral element resulted in almost all of these elements being considered as ''high quality'' when in fact, they could be severely skewed or stretched. Based on this inconsistency, a change was implemented to measure the quadrilaterals skew and aspect ratio. As these metrics increase the associated quality of the quadrilateral element decrease. The application of quadrilaterals to the ARR plot may be modified further since aspect ratio is not always considered a bad thing. However, this varies from engine to engine. | |||
==References== | |||
{{reflist}} | |||
<!--Sarrate, J. , Palau, J. and Huerta, A. (2003), Numerical representation of the quality measures of triangles and triangular meshes. Commun. Numer. Meth. Engng., 19: 551-561.--> | |||
== Related Topics == | == Related Topics == | ||
| Line 50: | Line 75: | ||
[[Category:SMS Plots|A]] | [[Category:SMS Plots|A]] | ||
[[Category:Equations]] | |||
Latest revision as of 18:10, 11 September 2023
The Angle Representation Region (ARR) plot is used to assess the overall quality of a triangular mesh such as those used by ADH, ADCIRC and other numerical engines. When the plot wizard is selected, this option appears if the mesh module is enabled. Clicking finish in the Plot Wizard results in an ARR plot for the current unstructured mesh, loaded in SMS.
The plot includes the ARR region, a point for each of the lowest quality elements in the mesh (the number of points included has varied from one version of SMS to another and is currently at 200), and three contour lines (0.3 in red, 0.45 in yellow and 0.6 in green) of the currently selected element quality measure. As a general rule, elements with quality lower than 0.3 should be reviewed and improved (mesh editing) if possible.
Click on any point in the plot to see the element ID associated with that point and the six quality measure values for that element.
Once the mesh is edited in any way, update the ARR plot by right-clicking in the plot and selecting Refresh. Until this is done, the plot will continue to reflect the mesh that existed when it was generated, or most recently refreshed.
This plot is based on a paper entitled "Numerical representation of the quality measures of triangles and triangular meshes".[1] Several of the figures below are derived from this paper.
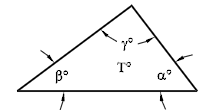
To assess the quality of a triangular mesh, such as those used by ADH or ADCIRC, the quality of each element is represented as a point based on the interior angles of that element. These interior angles are labeled α, β, and γ as shown:
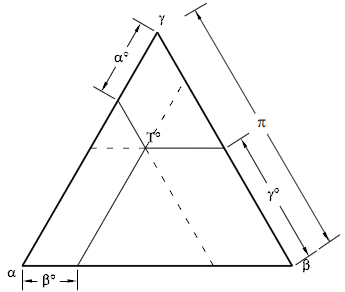
Plot these three angles into an equilateral triangle.
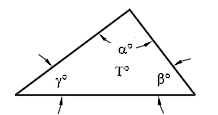
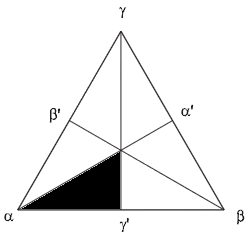
If ordering the three angles so that α > β > γ as shown below, all of the points will fall into the shaded portion of the equilateral triangle. This is referred to as the ARR region.
The quality of the elements is further assessed by computing a quality measure from attributes of the triangle. These attributes include:
- The minimum interior angle αmin(γ from previous figure).
- The lengths of edges
- The triangle area
- The inner and outer radius
- The minimum distance through the triangle (hmin)
These measures vary from 0.0 at the edges of the equilateral triangle to 1.0 at the center. The measures supported by SMS include:
The following figures show how each of these quality measures cover the ARR
Right-Click Options
Right-click on the ARR mesh quality assessment plot will some options for viewing the plot. These options include:
- Alpha-min Quality Measure
- ALS Quality Measure
- Rr Quality Measure
- Lr Quality Measure
- Lh quality Measure
Observation Profile Troubleshooting
If a plot will not generate or does not display significant data, it's possible that the conditions for the plot have not been set up correctly. To get a meaningful plot, take the following into account:
- This plot requires a mesh.
- If there are multiples meshes, make sure the correct mesh is active in the Project Explorer to get the desired data. If the correct mesh is active in the Project Explorer, and the plot still doesn't seem to represent the mesh accurately, then try right-clicking in the plot window and using the Refresh Plot command. This redraws the plot to represent the most recent information from SMS.
- Refreshing the plot is also useful if the mesh was recently edited. The plot will refresh to show the most recent results for the active mesh.
- This plot will only represent the quality of the triangular elements of a mesh. If there are both quadrilaterals and triangles in a mesh, then it does not necessarily accurately represent the overall quality of the mesh.
ARR Applied to Quadrilaterals
It should be noted that meshes that include quadrilateral elements do not match the theory of the ARR plot methodology as defined in the associated publications. Since ARR was derived to apply to triangular meshes, the SMS development team modified the approach to apply in some way to quadrilateral elements. It should be noted that the approach for quadrilaterals in SMS 13.1 and before was deemed to be inconsistent and was therefore modified in version 13.2 and newer. The original approach tended to ignore quadrilateral elements or give them a higher quality rating than similar triangular elements. Therefore, an ARR plot for a mesh containing quadrilaterals that was dominated by triangular elements in version 13.1 and earlier, may be dominated by quadrilateral elements in version 13.2 and later. If a uniform comparison is desired, it is suggested that the mesh which contains quadrilateral elements be duplicated and all the quads split into triangles.
Originally, the application of quadrilateral elements to the ARR plot used the same interior angle limits that are applied to triangles. This ignores the fact that an ideal triangular element consists of an equilateral triangle, while an ideal quadrilateral element consists of a square. Using only the internal angle measures for the quadrilateral element resulted in almost all of these elements being considered as high quality when in fact, they could be severely skewed or stretched. Based on this inconsistency, a change was implemented to measure the quadrilaterals skew and aspect ratio. As these metrics increase the associated quality of the quadrilateral element decrease. The application of quadrilaterals to the ARR plot may be modified further since aspect ratio is not always considered a bad thing. However, this varies from engine to engine.
References
Related Topics
SMS – Surface-water Modeling System | ||
|---|---|---|
| Modules: | 1D Grid • Cartesian Grid • Curvilinear Grid • GIS • Map • Mesh • Particle • Quadtree • Raster • Scatter • UGrid |  |
| General Models: | 3D Structure • FVCOM • Generic • PTM | |
| Coastal Models: | ADCIRC • BOUSS-2D • CGWAVE • CMS-Flow • CMS-Wave • GenCade • STWAVE • WAM | |
| Riverine/Estuarine Models: | AdH • HEC-RAS • HYDRO AS-2D • RMA2 • RMA4 • SRH-2D • TUFLOW • TUFLOW FV | |
| Aquaveo • SMS Tutorials • SMS Workflows | ||
