SMS:Spectral Energy: Difference between revisions
From XMS Wiki
Jump to navigationJump to search
No edit summary |
|||
| Line 24: | Line 24: | ||
* '''Export Spectra''' – Brings up the ''Export Spectra'' dialog where a location can be chosen to save the spectra.--> | * '''Export Spectra''' – Brings up the ''Export Spectra'' dialog where a location can be chosen to save the spectra.--> | ||
* '''Delete Grid''' or '''Delete Dataset''' – Deletes a grid or spectrum. | * '''Delete Grid''' or '''Delete Dataset''' – Deletes a grid or spectrum. | ||
* '''Properties''' – Brings up | * '''Properties''' – Brings up ''Dataset Info''. This option is available when the grid in the ''Spectral Manager Tree'' is right-clicked. | ||
<!--* '''Edit Time''' – Edit the time offset for the dataset.--> | <!--* '''Edit Time''' – Edit the time offset for the dataset.--> | ||
Revision as of 15:22, 28 May 2024
File:Spectral Energy.png
Spectral Energy dialog
The Spectral Energy dialog can be accessed when the spectral coverage is active. The dialog is opened by either double-clicking on a selected node/point or by right-clicking on a selected point and choosing the Point Attributes command. The spectrum represents energy densities at discrete values over a range of angles and a range of frequencies for a given wave condition.
Tools
 Select Cell – Select a cell corner to view or edit the energy value.
 Pan – Pan the spectral grid.
 Zoom – Zoom in the window.
 Rotate – Rotate in the window.
 Frame – Frame, or zoom to the extents of the grid.
 Contour Options – Bring up the contour options dialog for setting the spectral grid contour display options.
Grid Options
- Create Grid – Brings up the Spectral Grid Attributes dialog followed by the Create Spectral Energy Grid dialog.
- Spectra – Brings up the Generate Spectra dialog.
Spectral Tree Options
- Spectral Manager Tree – Select a spectrum in the tree. The selected spectra will be displayed in the Spectral Viewer. The tree’s right-click options are described below.
Grid/Spectra Right-Click Options
- Delete Grid or Delete Dataset – Deletes a grid or spectrum.
- Properties – Brings up Dataset Info. This option is available when the grid in the Spectral Manager Tree is right-clicked.
View Options
- View – View and edit the spectral grid using a Cartesian or polar view.
Graphic Options
Information for points in the grid can be displayed in two ways:
- Selection – View the Frequency, Angle, and Energy of the selected cell corner. The Energy can be edited for the selected points.
- Cursor – View the Frequency, Angle, and Energy as the cursor moves over the grid.
2D Plot Options
- Frequency Integration Plot – Turn on to show an energy vs. frequency plot for the selected spectrum.
- Direction Integration Plot – Turn on to show a direction vs. energy plot for the selected spectrum.
Reference Time
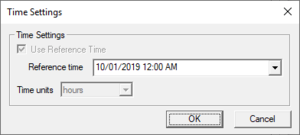
Clicking on the Update Reference Time... button will bring up the Time Settings dialog with the following options.
- Reference Time – Specify the reference time for all datasets assigned to the node
- Time Units – Specify the units for the time offsets assigned to the datasets
Related Topics
- Create Spectral Energy Grid
- Generate Spectra
- Import Spectra
- Spectral Grid Properties
- STWAVE Menu
- CGWAVE Menu
- Cartesian Grid Module
SMS – Surface-water Modeling System | ||
|---|---|---|
| Modules: | 1D Grid • Cartesian Grid • Curvilinear Grid • GIS • Map • Mesh • Particle • Quadtree • Raster • Scatter • UGrid |  |
| General Models: | 3D Structure • FVCOM • Generic • PTM | |
| Coastal Models: | ADCIRC • BOUSS-2D • CGWAVE • CMS-Flow • CMS-Wave • GenCade • STWAVE • WAM | |
| Riverine/Estuarine Models: | AdH • HEC-RAS • HYDRO AS-2D • RMA2 • RMA4 • SRH-2D • TUFLOW • TUFLOW FV | |
| Aquaveo • SMS Tutorials • SMS Workflows | ||
