GMS:The GMS Window: Difference between revisions
No edit summary |
No edit summary |
||
| Line 1: | Line 1: | ||
{{hide in print|[[Image:GMS_screen.jpg]]}} | {{hide in print|[[Image:GMS_screen.jpg]]}} | ||
{{only in print|[[Image:GMS_screen.jpg|400px | {{only in print|[[Image:GMS_screen.jpg|400px]]}} | ||
The GMS screen is divided into seven main sections: | The GMS screen is divided into seven main sections: | ||
| Line 12: | Line 12: | ||
{{hide in print|[[Image:editwind.jpg]]}} | {{hide in print|[[Image:editwind.jpg]]}} | ||
{{only in print|[[Image:editwind.jpg|300px | {{only in print|[[Image:editwind.jpg|300px]]}} | ||
===Tool Palette=== | ===Tool Palette=== | ||
| Line 21: | Line 21: | ||
{{hide in print|[[Image:graphics_window.jpg|600px]]}} | {{hide in print|[[Image:graphics_window.jpg|600px]]}} | ||
{{only in print|[[Image:graphics_window.jpg|250px | {{only in print|[[Image:graphics_window.jpg|250px]]}} | ||
Every object that can be selected in the Graphics Window now has a corresponding right-click menu available. These menus contain commands that allow the user to manipulate the data or display of the selected items. | Every object that can be selected in the Graphics Window now has a corresponding right-click menu available. These menus contain commands that allow the user to manipulate the data or display of the selected items. | ||
| Line 29: | Line 29: | ||
===Project Explorer=== | ===Project Explorer=== | ||
{{only in print|[[Image:Tree_General.jpg|100px | {{only in print|[[Image:Tree_General.jpg|100px]]}} | ||
The [[GMS:Project Explorer|Project Explorer]] is located at the left side of the GMS window by default, but it can be moved to anywhere on the window since it is a dockable toolbar. The [[GMS:Project Explorer|Project Explorer]] contains a hierarchical representation of the data associated with a modeling project. The [[GMS:Project Explorer|Project Explorer]] can also be resized simply by clicking on the window borders and dragging them to a new location. | The [[GMS:Project Explorer|Project Explorer]] is located at the left side of the GMS window by default, but it can be moved to anywhere on the window since it is a dockable toolbar. The [[GMS:Project Explorer|Project Explorer]] contains a hierarchical representation of the data associated with a modeling project. The [[GMS:Project Explorer|Project Explorer]] can also be resized simply by clicking on the window borders and dragging them to a new location. | ||
| Line 50: | Line 50: | ||
{{hide in print|[[Image:StatusBar.jpg]]}} | {{hide in print|[[Image:StatusBar.jpg]]}} | ||
{{only in print|[[Image:StatusBar.jpg|350px | {{only in print|[[Image:StatusBar.jpg|350px]]}} | ||
{{Navbox GMS}} | {{Navbox GMS}} | ||
[[Category:GMS General Information]] | [[Category:GMS General Information]] | ||
Revision as of 23:50, 17 January 2012
The GMS screen is divided into seven main sections:
Menu Bar
Each module has its own set of menus. The first three menus (File, Edit, Display) are the same for every module. The remaining menus are dependent on the selected module.
Edit Window
These fields are used to edit the coordinates of selected items (vertices, nodes, scatter points, etc.). The coordinates are changed by typing in new values and hitting the ENTER or TAB key. The scalar data value (F:) associated with the selected object can also be edited.
Tool Palette
Several Tool Palettes can be displayed in the GMS interface. Default tool palettes include the Macros Palette, the Static Tool Palette, the Dynamic Tool Palette, the Mini-Grid Plot Palette, and the Module Palette. (For more information on each of these palettes see Tool Palettes)
Graphics Window
The primary graphical input and output for GMS takes place in the Graphics Window. The action taken when you interact with the Graphics Window depends on which tool is selected.
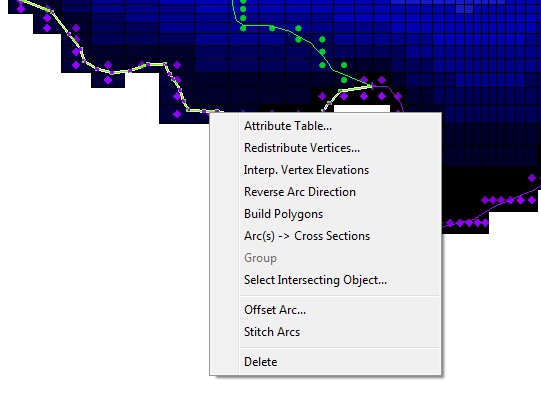
Every object that can be selected in the Graphics Window now has a corresponding right-click menu available. These menus contain commands that allow the user to manipulate the data or display of the selected items.
Project Explorer
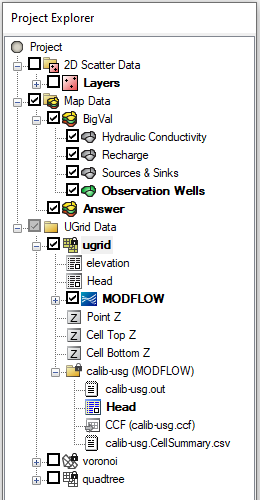
The Project Explorer is located at the left side of the GMS window by default, but it can be moved to anywhere on the window since it is a dockable toolbar. The Project Explorer contains a hierarchical representation of the data associated with a modeling project. The Project Explorer can also be resized simply by clicking on the window borders and dragging them to a new location.
Many commands on the data in GMS can be executed by right-clicks in the Project Explorer. For general commands or to create new data objects you can right-click on the empty space in the Project Explorer and the following pop-up menu is available. The visibility of items in the Graphics Window can also be controlled by selecting the toggle next to each item in the Project Explorer.
Project Explorer View
Time Step Window
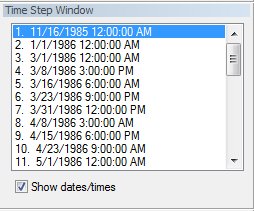
The Time Step Window is located below the Project Explorer by default, but it can be moved to anywhere on the window since it is a "dockable" toolbar. The Time Step Window only appears when a transient data set is selected in the Project Explorer. Time steps can be viewed in date/time format or relative time format by selecting the toggle below the Time Step Window. The Time Step Window can be resized simply by clicking on the window borders and dragging them to a new location.
Status Bar
The Status Bar is used to display the cursor coordinates, the IJK indices of the cell beneath the cursor, the data set value beneath the cursor, data associated to selected items, and other information.
GMS – Groundwater Modeling System | ||
|---|---|---|
| Modules: | 2D Grid • 2D Mesh • 2D Scatter Point • 3D Grid • 3D Mesh • 3D Scatter Point • Boreholes • GIS • Map • Solid • TINs • UGrids | |
| Models: | FEFLOW • FEMWATER • HydroGeoSphere • MODAEM • MODFLOW • MODPATH • mod-PATH3DU • MT3DMS • MT3D-USGS • PEST • PHT3D • RT3D • SEAM3D • SEAWAT • SEEP2D • T-PROGS • ZONEBUDGET | |
| Aquaveo | ||


