SMS:Time Series Plot: Difference between revisions
No edit summary |
|||
| Line 2: | Line 2: | ||
[[Image:TimeSeries. | [[Image:TimeSeries.png]] | ||
| Line 10: | Line 10: | ||
After the plot type is set in Step 1 of the ''Plot Wizard'', define the time interval and the scalar dataset desired for the plot in Step 2. When this is completed, click '''Finish''' and the plot will be generated. | After the plot type is set in Step 1 of the ''Plot Wizard'', define the time interval and the scalar dataset desired for the plot in Step 2. When this is completed, click '''Finish''' and the plot will be generated. | ||
*''Use active dataset'' – This option causes the plot to display the values of the active dataset for each observation point being plotted. When the active dataset changes, the plot is recomputed and updated. | |||
*''Use selected dataset'' – This option causes the plot to display the values of one or more specified datasets for each point being plotted. Changing the active dataset does not affect the plot. Select the dataset from the list box by putting a check in the dataset's check box. | |||
*''Use calibration data'' – This allows displaying the calibration curve defined for each point. If there is no calibration data for the entity, leave the box unchecked and the calibration data will not be displayed. | |||
For more information concerning how to edit the ''Time Settings'', see [[SMS:Plot Window|Plot Window]]. | For more information concerning how to edit the ''Time Settings'', see [[SMS:Plot Window|Plot Window]]. | ||
Revision as of 15:07, 25 April 2016
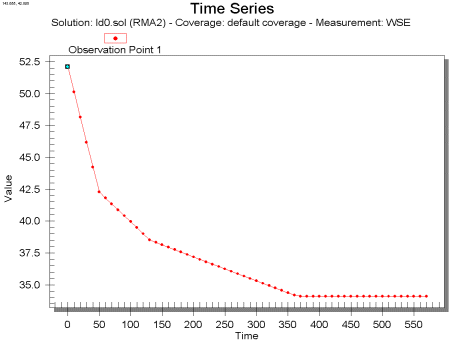
A Time Series plot is used to display the time variation of one or more scalar datasets associated with a mesh or grid at observation points in an Observation coverage. In addition, if transient calibration data has been defined, a band can be shown which represents a time variant Calibration Target. Only transient data sets may be used in these plots. Time Series plots are created by using the Plot Wizard, found in the Display menu, and selecting "Time Series" from the plot type list in Step 1 of the Plot Wizard. A sample plot, with calibration target band, is shown in the figure below.
Time Series Plot Options
After the plot type is set in Step 1 of the Plot Wizard, define the time interval and the scalar dataset desired for the plot in Step 2. When this is completed, click Finish and the plot will be generated.
- Use active dataset – This option causes the plot to display the values of the active dataset for each observation point being plotted. When the active dataset changes, the plot is recomputed and updated.
- Use selected dataset – This option causes the plot to display the values of one or more specified datasets for each point being plotted. Changing the active dataset does not affect the plot. Select the dataset from the list box by putting a check in the dataset's check box.
- Use calibration data – This allows displaying the calibration curve defined for each point. If there is no calibration data for the entity, leave the box unchecked and the calibration data will not be displayed.
For more information concerning how to edit the Time Settings, see Plot Window.
Related Topics
SMS – Surface-water Modeling System | ||
|---|---|---|
| Modules: | 1D Grid • Cartesian Grid • Curvilinear Grid • GIS • Map • Mesh • Particle • Quadtree • Raster • Scatter • UGrid |  |
| General Models: | 3D Structure • FVCOM • Generic • PTM | |
| Coastal Models: | ADCIRC • BOUSS-2D • CGWAVE • CMS-Flow • CMS-Wave • GenCade • STWAVE • WAM | |
| Riverine/Estuarine Models: | AdH • HEC-RAS • HYDRO AS-2D • RMA2 • RMA4 • SRH-2D • TUFLOW • TUFLOW FV | |
| Aquaveo • SMS Tutorials • SMS Workflows | ||
