SMS:Raster Functionalities: Difference between revisions
No edit summary |
|||
| Line 15: | Line 15: | ||
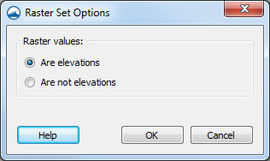
By default data associated with the raster is stored as elevation/z data. If a rasters projection is changed and the units change from meters to feet, the z values also would change. This becomes problematic if the raster values is used to represent NCLD land data and not elevation data. To keep NCLD land data from being projected, a user can specify this in the [[SMS:Raster Module#Raster Sets|raster set]]. This is done by right-clicking on the raster set and selecting '''Options..'''. A dialog appears allowing a user to specify if the values are elevations or not elevations. If raster values are set as not elevations, when doing a projection the z values will remain unchanged. | By default data associated with the raster is stored as elevation/z data. If a rasters projection is changed and the units change from meters to feet, the z values also would change. This becomes problematic if the raster values is used to represent NCLD land data and not elevation data. To keep NCLD land data from being projected, a user can specify this in the [[SMS:Raster Module#Raster Sets|raster set]]. This is done by right-clicking on the raster set and selecting '''Options..'''. A dialog appears allowing a user to specify if the values are elevations or not elevations. If raster values are set as not elevations, when doing a projection the z values will remain unchanged. | ||
[[File:SMSrasterOptions.jpg|thumb|none|left| | [[File:SMSrasterOptions.jpg|thumb|none|left|270 px|Example of the ''Raster Set Options'' dialog.]] | ||
==Related Topics== | ==Related Topics== | ||
Revision as of 14:04, 14 July 2015
Profile Plot
SMS can generate many different types of 2D plots. Scalar data contained in visible rasters may be plotted using a specific type of 2D plot called a profile plot. When creating a profile plot for a raster using the Plot Wizard and 'specified data' is selected in Step 2, be sure to set the appropriate "Raster Set". Data will be plotted from the rasters in the selected raster set.
Interpolation
Values contained in rasters can be interpolated to existing scattersets, 2D meshes, and 2D grids. To interpolate the values from a raster, right-click on the raster set in the project explorer and choose Interpolate. Then choose the appropriate option for the object the user wishes to interpolate to.
Convert to Scatter
Values from rasters can also be converted into scatter data. This is done by right-clicking on the raster item in the Project Explorer and selecting Convert | Raster→2D Scatter.
In special cases, one would want to convert only a selected portion of the raster to scatter data. For more information, see Raster Tools.
Raster Values as Elevation / Z Data
By default data associated with the raster is stored as elevation/z data. If a rasters projection is changed and the units change from meters to feet, the z values also would change. This becomes problematic if the raster values is used to represent NCLD land data and not elevation data. To keep NCLD land data from being projected, a user can specify this in the raster set. This is done by right-clicking on the raster set and selecting Options... A dialog appears allowing a user to specify if the values are elevations or not elevations. If raster values are set as not elevations, when doing a projection the z values will remain unchanged.
Related Topics
SMS – Surface-water Modeling System | ||
|---|---|---|
| Modules: | 1D Grid • Cartesian Grid • Curvilinear Grid • GIS • Map • Mesh • Particle • Quadtree • Raster • Scatter • UGrid |  |
| General Models: | 3D Structure • FVCOM • Generic • PTM | |
| Coastal Models: | ADCIRC • BOUSS-2D • CGWAVE • CMS-Flow • CMS-Wave • GenCade • STWAVE • WAM | |
| Riverine/Estuarine Models: | AdH • HEC-RAS • HYDRO AS-2D • RMA2 • RMA4 • SRH-2D • TUFLOW • TUFLOW FV | |
| Aquaveo • SMS Tutorials • SMS Workflows | ||
