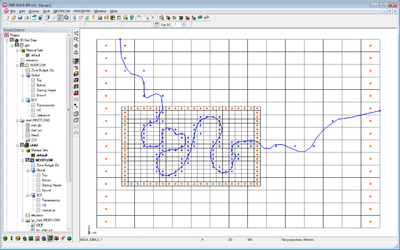
Various images generated by GMS. Please follow these guidelines when posting images.
Black background
All these images have the background color set to black.
 Solid cross sections and boreholes. |
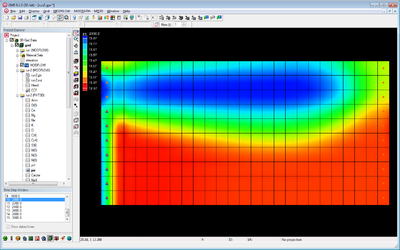
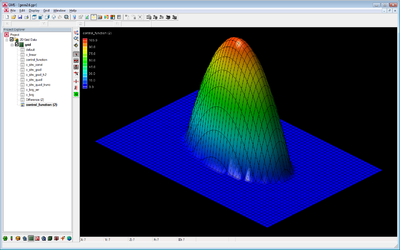 2D grid filled contours with an elliptical dataset. |
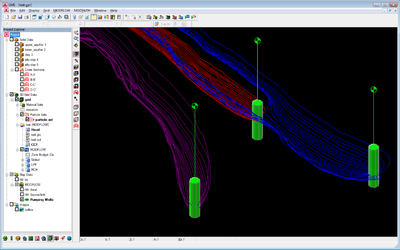 MODPATH pathlines around well screens in 3D. |
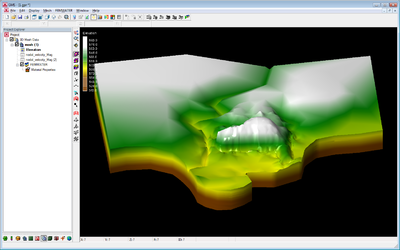 3D mesh with continuous contours using an elevation palette. |
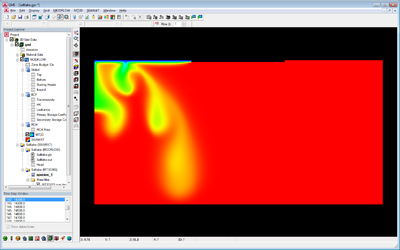 SEAWAT salt lake experiment showing salt water fingering. |
 Isosurface on a 3D grid and borehole sample data. |
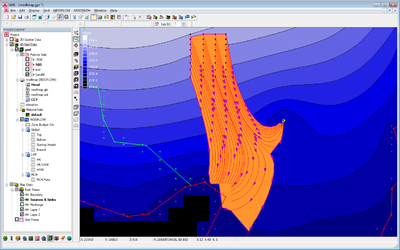 MODPATH pathlines from a landfill to a river and well. |
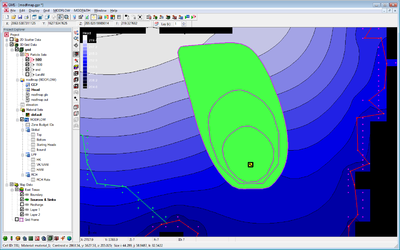 MODPATH nested capture zones at different times. |
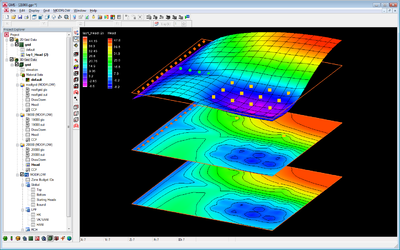 3D grid layer contours and a 2D grid in oblique view |
 Calibration targets and plots on a MODFLOW model. |
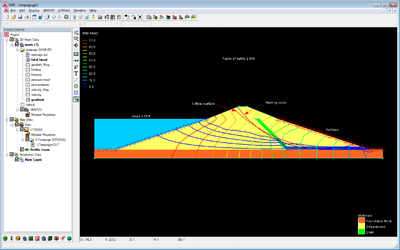 Profile of a dam with a flow net and critical surface. |
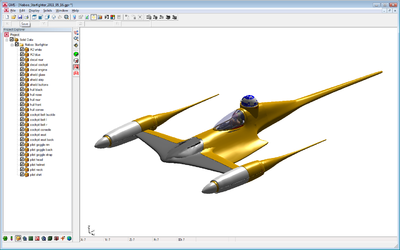
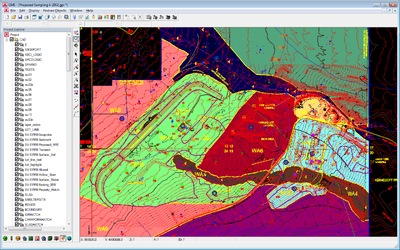 Complex CAD file rendered in GMS. |
 LiDAR data of river and levee. |
|
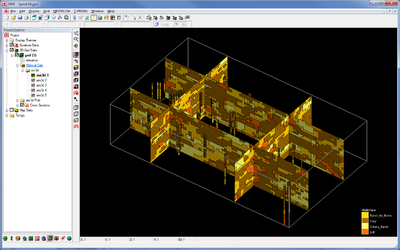 Boreholes and cross-sections of TPROGS generated materials set. |
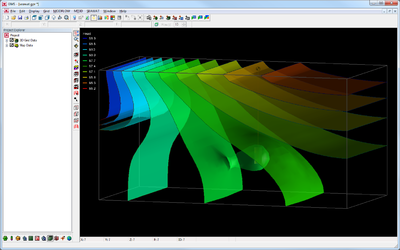 Isosurfaces of MODFLOW computed heads. |
 Woburn site solids generated in GMS |
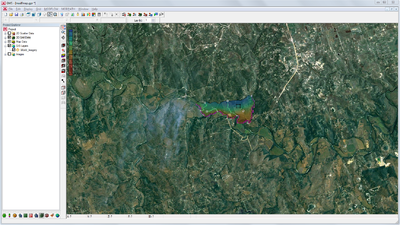 ESRI world imagery background map in GMS |
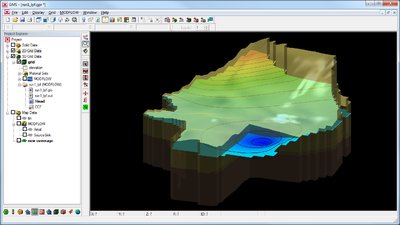 MODFLOW computed water table in 3D. |
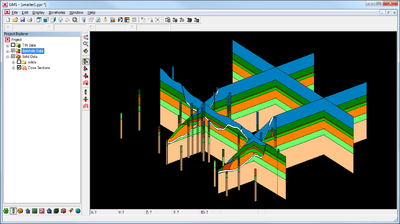 Boreholes and cross sections from a solid model. |
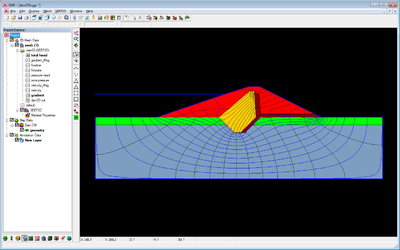 SEEP2D model of an earth dam. |
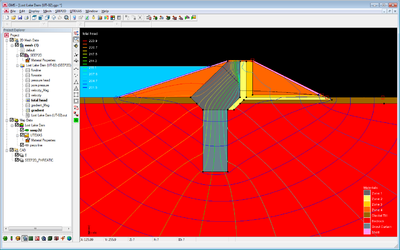 SEEP2D model of Lost Lake dam. |
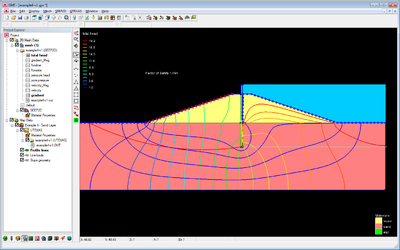 SEEP2D model of a dam with a wall. |
 SEEP2D model of a complex dam. |
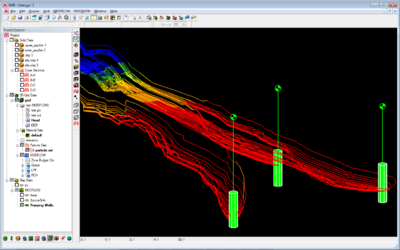 MODPATH pathlines showing color by zone code display option. |
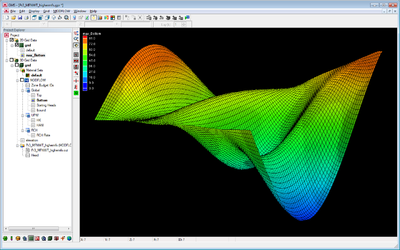 Similar to image from MODFLOW-NWT documentation. |
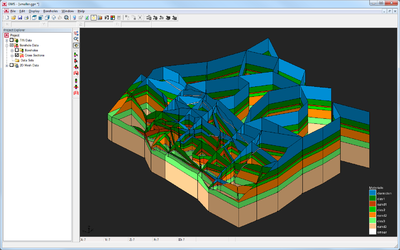 User-define cross sections to characterize a slope failure. |
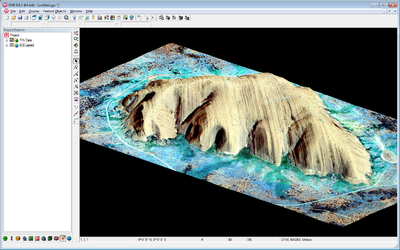 Ayers Rock - World imagery, ASTER GDEM elevations. |
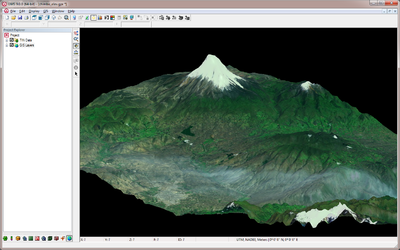 Mount Chimborazo - World imagery, ASTER GDEM elevations. |
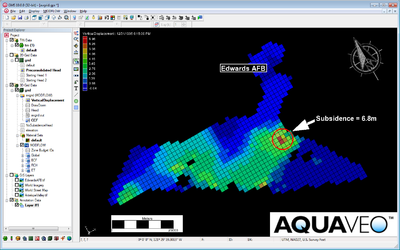
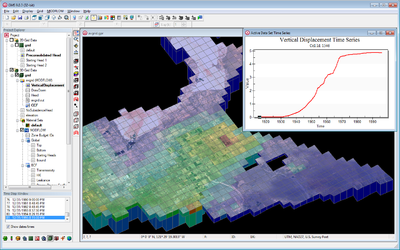 SUB package vertical displacement plot. |
|
|
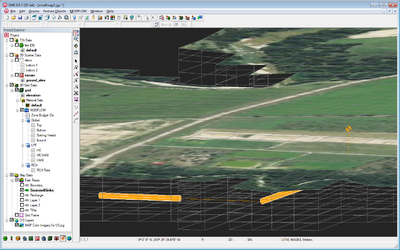 MNW2 Slanted and horizontal well screens. |
 MODFLOW model in side view with water table displayed. |
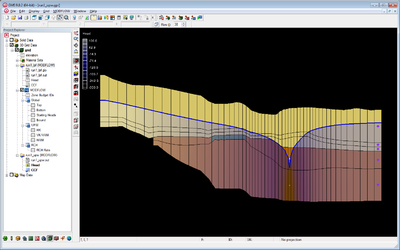 MODFLOW model in side view with water table displayed. |
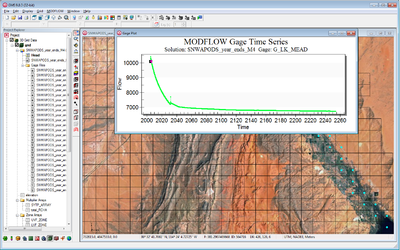 GAGE plot of SFR flow vs. time. |
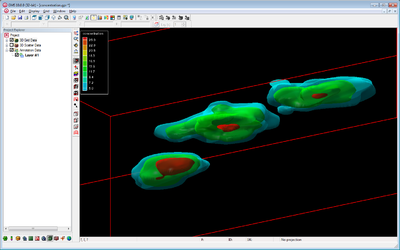 Isosurfaces of interpolated concentrations. |
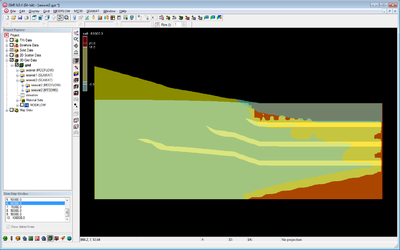 SEAWAT model of layered coastal aquifer. |
|
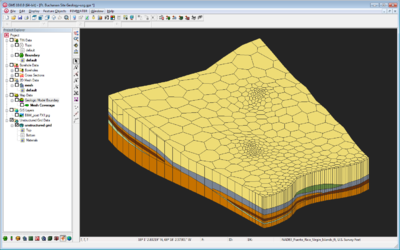 Horizons to voronoi unstructured grid. |
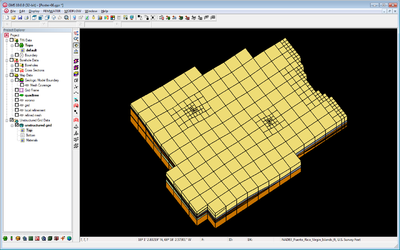 Horizons to quadtree unstructured grid. |
|
 Sacramento Regional model. |
|
|
|
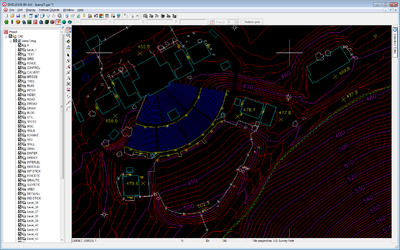 DGN (MicroStation) cad file. |
White background
Same as above but with the background color set to white.
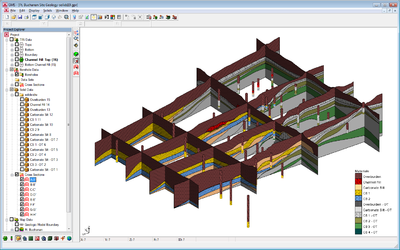 Solid cross sections and boreholes. |
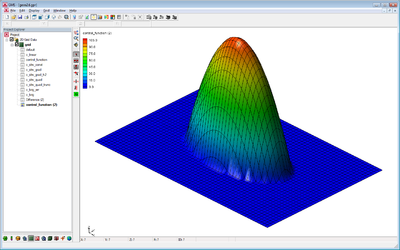 2D grid filled contours with an elliptical data set. |
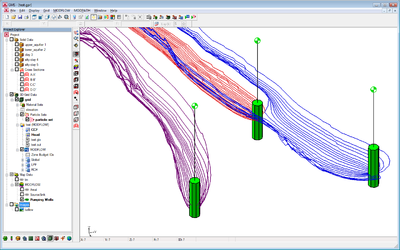 MODPATH pathlines around well screens in 3D. |
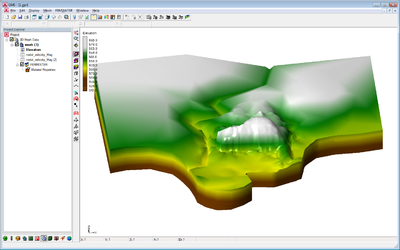 3D mesh with continuous contours using an elevation palette. |
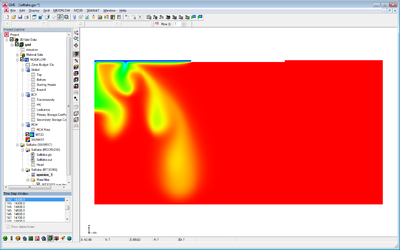 SEAWAT salt lake experiment showing salt water fingering. |
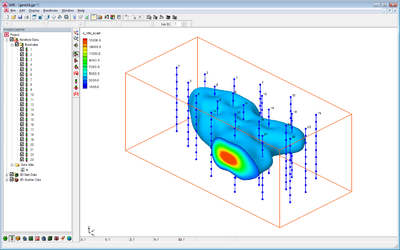 Isosurface on a 3D grid and borehole sample data. |
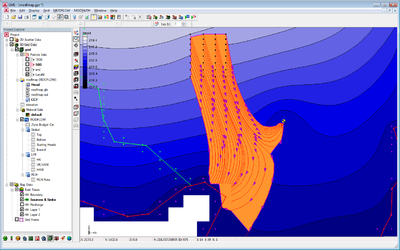 MODPATH pathlines from a landfill to a river and well. |
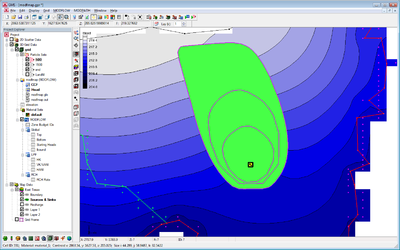 MODPATH nested capture zones at different times. |
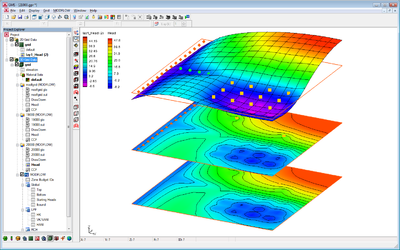 3D grid layer contours and a 2D grid in oblique view. |
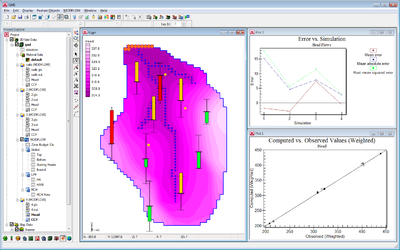 Calibration targets and plots on a MODFLOW model. |
 Profile of a dam with a flow net and critical surface. |
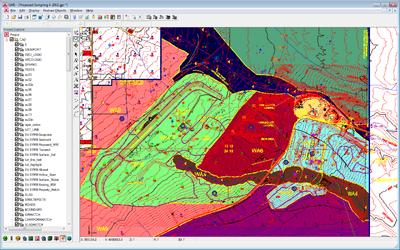 Complex CAD file rendered in GMS. |
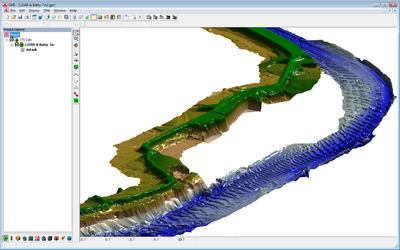 LiDAR data of river and levee. |
|
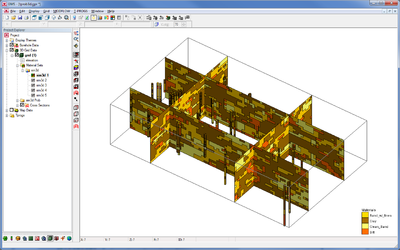 Boreholes and cross-sections of TPROGS generated materials set. |
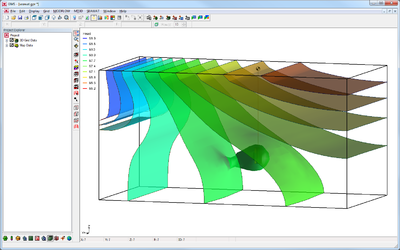 Isosurfaces of MODFLOW computed heads. |
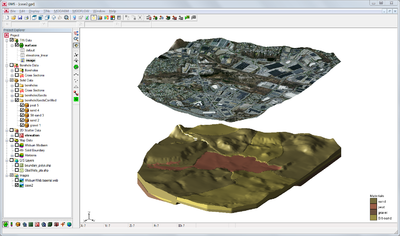 Woburn site solids generated in GMS |
 ESRI world imagery background map in GMS |
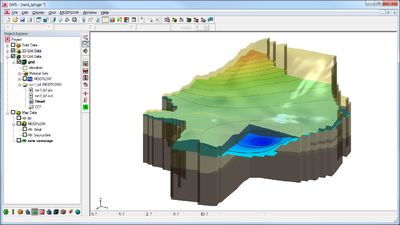 MODFLOW computed water table in 3D. |
 Boreholes and cross sections from a solid model. |
 SEEP2D model of an earth dam. |
 SEEP2D model of Lost Lake dam. |
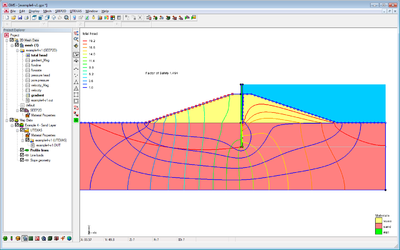 SEEP2D model of a dam with a wall. |
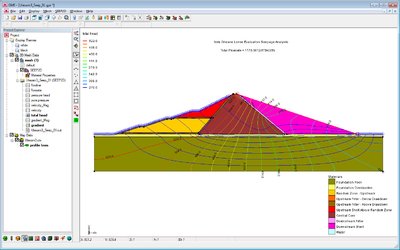 SEEP2D model of a complex dam. |
 MODPATH pathlines showing color by zone code display option. |
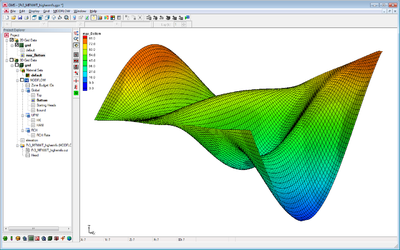 Similar to image from MODFLOW-NWT documentation. |
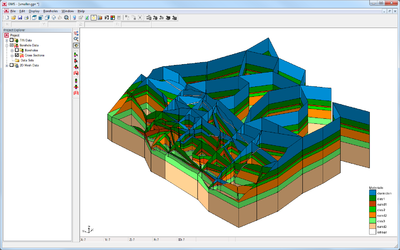 User-defined cross sections to characterize a slope failure. |
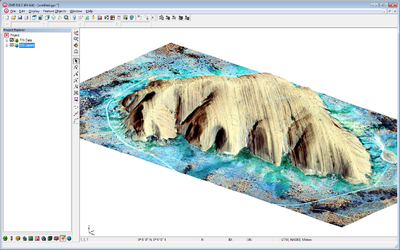 Ayers Rock - World imagery, ASTER GDEM elevations. |
 Mount Chimborazo - World imagery, ASTER GDEM elevations. |
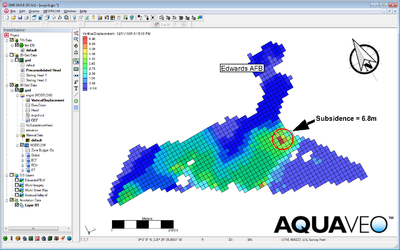
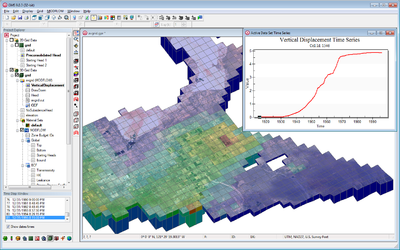 SUB package vertical displacement plot. |
|
|
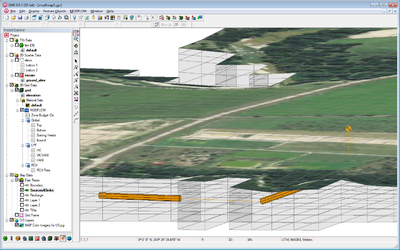 MNW2 Slanted and horizontal well screens. |
 MODFLOW model in side view with water table displayed. |
 MODFLOW model in side view with water table displayed. |
 GAGE plot of SFR flow vs. time. |
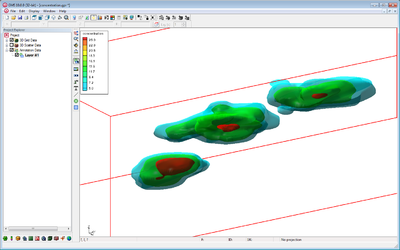 Isosurfaces of interpolated concentration. |
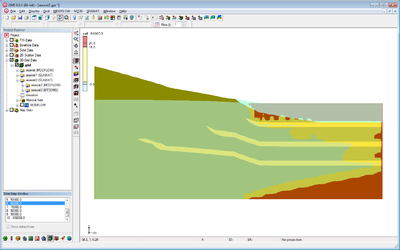 SEAWAT model of layered coastal aquifer. |
|
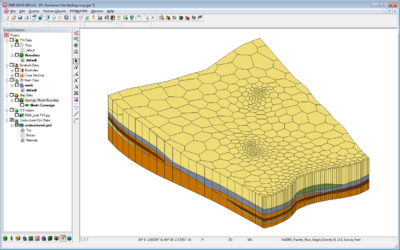 Horizons to voronoi unstructured grid. |
 Horizons to quadtree unstructured grid. |
|
 Sacramento Regional model. |
|
|
|
 DGN (MicroStation) cad file. |


