SMS:SRH-2D Channel Calculator
| This contains information about functionality available starting at SMS version 13.1. The content may not apply to other versions. |
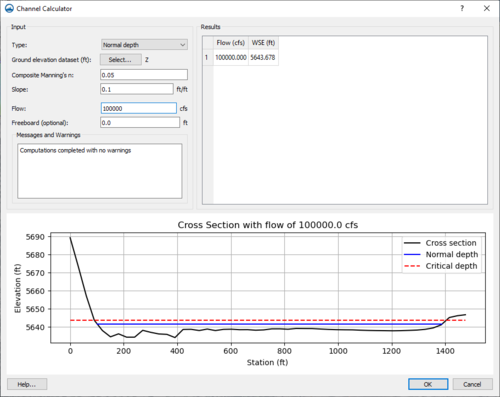
The Channel Calculator dialog is used to generate an estimated water surface elevation on an "Exit-H" boundary condition. The tool is used to compute and assign a normal or critical water surface elevation for the outflow boundary condition. A composite roughness value, slope, and flow are specified when using this tool. SMS extracts a ground elevation cross section from a specified underlying elevation data source (mesh) that is used to compute the area and wetted perimeter.
When using this option, the tool will snap the arc to the mesh and apply in the same manner that the boundary condition will apply in SRH-2D.
Note that the units selected in the SRH-2D Assign BC dialog will affect the units displayed and used in the Channel Calculator dialog. Select the same unit system as the selected dataset.
Channel Calculator for Populating a Constant WSE
This dialog is reached through the Populate Using Channel Calculator button in the SRH-2D Assign BC dialog when the "Exit-H (subcritical outflow)" option is selected and the Water Elevation (WSE) is set to "Constant". The dialog is used to generate a best estimate water surface elevation constant value.
- Type – Select either a normal or critical depth.
- "Normal depth" – Depth of water under conditions of steady, uniform flow.
- "Critical depth" – Depth of flow where energy is at a minimum discharge.
- Ground Elevation Dataset – Brings up a Select Tree Item dialog were an elevation dataset can be selected as wel as any time steps in the dataset can be chosen. Note that the unit system selected on the SRH-2D Assign BC dialog need to match the units of the selected dataset.
- Composite Mannings N – Enter a roughness value.
- Slope – Water surface slope. Required for normal depth.
- Flow – Enter a constant flow value.
- Freeboard (optional) – Additional feet or meters to add to the elevation.
- Messages and Warnings – Displays any messages or warnings. Typically, this will display missing input that needs to be completed.
- Plot – Generates a plot of the WSE flow after the required values have been entered.
- Results – Displays the final calculated water-surface elevation based on the entered flow.
Populate for Rating Curve
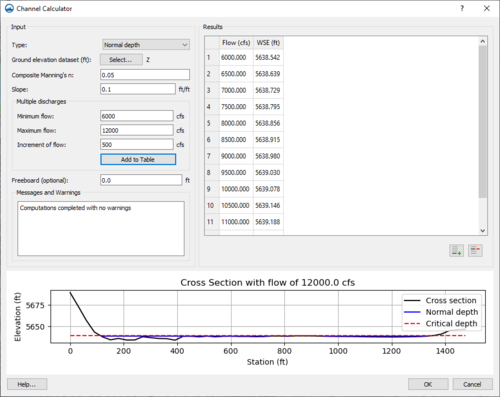
This dialog is reached through the Populate Using Channel Calculator button in the SRH-2D Assign BC dialog when the "Exit-H (subcritical outflow)" option is selected and the Water Elevation (WSE) is set to "Rating Curve". The dialog will generate a best estimate of the rating curve variables. The variables will be automatically entered for the rating curve in the XY Series Editor when exiting this dialog.
- Type – Select either a normal or critical depth rating curve.
- "Normal depth rating curve" – Depth of water under conditions of steady, uniform flow.
- "Critical depth rating curve" – Depth of flow where energy is at a minimum discharge.
- Ground Elevation Dataset – Brings up a Select Tree Item dialog were an elevation dataset can be selected as wel as any time steps in the dataset can be chosen. Note that the unit system selected on the SRH-2D Assign BC dialog need to match the units of the selected dataset.
- Composite Mannings N – Enter a roughness value.
- Slope – Water surface slope. Required for normal depth.
- Multiple Discharges – Generate the flow values by entering the following values and clicking the Add button.
- Minimum Flow – Minimum flow value.
- Maximum Flow – Maximum flow value.
- Increment of Flow – The amount that the flow will increase by until it reaches the max flow.
- Add to Table – Generates the flow rating curve based on the Multiple Discharges inputs. The values are shown in the Flow (Q) table.
- Freeboard (optional) – The head measured from the maximum water level to the uppermost watertight portion of the surrounding channel.
- Messages and Warnings – Displays any messages or warnings. Typically, this will display missing input that needs to be completed.
- Plot – Generates a plot of the WSE flow after the required values have been entered.
- Results – Shows the flow values and computed WSE values that will be used in the rating curve. Flow values in the table can be manually edited. New values can be added using the add row
 button and removed using the delete row
  button.
Related Topics
SMS – Surface-water Modeling System | ||
|---|---|---|
| Modules: | 1D Grid • Cartesian Grid • Curvilinear Grid • GIS • Map • Mesh • Particle • Quadtree • Raster • Scatter • UGrid |  |
| General Models: | 3D Structure • FVCOM • Generic • PTM | |
| Coastal Models: | ADCIRC • BOUSS-2D • CGWAVE • CMS-Flow • CMS-Wave • GenCade • STWAVE • WAM | |
| Riverine/Estuarine Models: | AdH • HEC-RAS • HYDRO AS-2D • RMA2 • RMA4 • SRH-2D • TUFLOW • TUFLOW FV | |
| Aquaveo • SMS Tutorials • SMS Workflows | ||

