User:Jcreer/SMS:3D Structures
The 3D bridge component can be used to for multiple purposes in a model. These include:
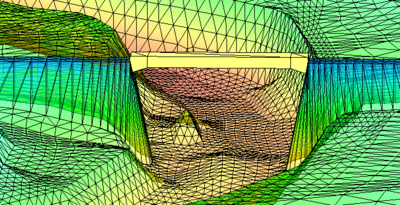
- The bridge component can be used to generate a 3D UGrid to visualize a bridge in the graphics window. Use the Add 3D Bridge UGrid to SMS on OK toggle in the Bridge dialog described below to generate this UGrid.
- The bridge component can be included in an observation plot. (See Observation Profile Plot for more information.)
- One or more bridge components can be used to generate a "ceiling elevation" dataset. This dataset represents the maximum water surface that can be reached at each point in the mesh. Nodes that have no ceiling elevation have an "inactive" value in this dataset. An upcoming version of SRH-2D will be able to utilize this dataset instead as an option to represent pressure zones. Each bridge also has a user specified Manning's N value for the underside of the bridge. Note: The ceiling elevation method of simulating pressure flow in SRH-2D is not compatible with pressure zone arcs in the simulation boundary conditions coverage. Only one of these approaches can be applied to a simulation.
To create a 3D bridge component, the following is needed:
- 3D bridge coverage containing two arcs. These arcs define the upstream and downstream sides of the bridge
- Top, upstream, and downstream profiles
Also, having an existing mesh, scatter set, or grid of the site is typically helpful.
Steps to Defining a 3D Structure
To build a 3D structure, do the following:
- Create an 3D structure coverage.
- Create two arcs representing the upstream and downstream side of the structuree location.
- Right-click on the 3D structure coverage and select Edit Structure.
- In the Structure Properties dialog, define the top profile, upstream profile, and downstream profile.
Note: CAD files of the structure design or as built configuration can be used to simplify the bridge definition. Having a topographic surface to display (2D mesh, UGrid, scatter set, grid or raster) in conjunction with the structure is also typically very helpful.
3D Bridge Modeling Tips
- The first arc drawn on the Area Properties coverage will be made the upstream arc by default. Use the Swap Arcs button in the Bridge dialog to change this.
- The bridge will use the same units as set in the project's projection.
- Multiple bridges can be modeled by creating addition components.
- When exporting the bridge, the XMUGRID file is created as well as a PRJ file containing the bridge's projection. These files should be kept together.
- When modeling piers, the stations cannot be at the same x location. This means the stations must be offset slightly for the vertical wall of the pier.
- Piers modeled using a 3D bridge should not be used to model piers in an SRH-2D pressure flow model. Piers for pressure flow in an SRH-2D should be modeled by creating a void in the mesh at the pier location.
3D Bridge Coverage
The 3D Bridge coverage is used like any other map coverage. Generally, it should have the arcs that define the upstream and downstream side of each bridge. In the Project Explorer, right-clicking on the 3D bridge coverage brings up the standard coverage right-click menu with the addition of the following command:
- Edit Bridge – Brings up the Bridge dialog for defining the bridge profiles.
Bridge Dialog
The Bridge dialog is reached by right-clicking on a bridge component and selecting the Edit Bridge... command. The dialog contains the following options:
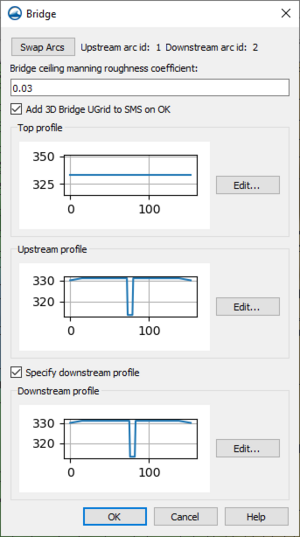
- Swap Arcs – Changes which arc is the upstream arc and which is the downstream arc.
- Bridge ceiling manning roughness coefficient – Define a Manning's N or roughness value for the bridge if used in a model run. In particular, this option is for use of a 3D bridge that is included in an SRh-2D pressure ceiling model.
- Add 3D Bridge UGrid to SMS on OK – Exports the 3D UGrid file containing the 3D bridge then imports the bridge UGrid into the SMS project.
- Export 3D Bridge – Brings up a Save dialog where the bridge can be saved as a ugrid.
- Top profile – Defines the highest points of the bridge.
- Edit... – Launches the XY Series Editor for the bridge profiles.
- Upstream Profile – Defines the elevations on the underside of the bridge on the upstream end side.
- Edit... – Launches the XY Series Editor for the bridge profiles.
- Specify downstream profile – The downstream profile will be the same as the upstream profile unless this option is turned on.
- Downstream profile – Defines the elevations on the underside of the bridge on the downstream end side.
- Edit... – Launches the XY Series Editor for the bridge profiles.
- Downstream profile – Defines the elevations on the underside of the bridge on the downstream end side.
XY Series Editor
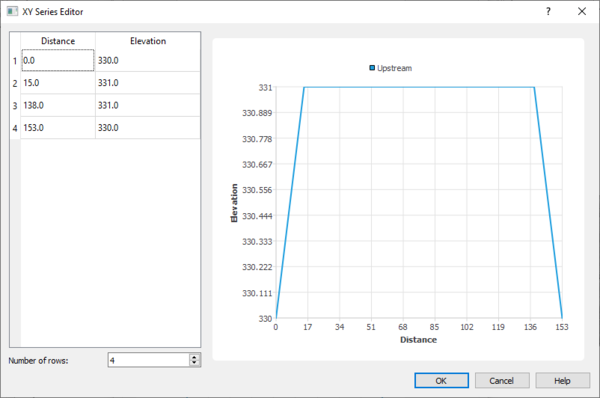
This dialog is reached through the Bridge dialog. The dialog contains the following:
- Number of Rows – Defines the number of rows available in the spreadsheet.
- Spreadsheet – Contains values for the profile distance and elevation.
- Distance – Location along the arc. The distance starts at the first node in the arc and moves in the same direction as the arc.
- Elevation – Elevation of the given distance.
- Preview area – Displays a preview of the profile.
SMS – Surface-water Modeling System | ||
|---|---|---|
| Modules: | 1D Grid • Cartesian Grid • Curvilinear Grid • GIS • Map • Mesh • Particle • Quadtree • Raster • Scatter • UGrid |  |
| General Models: | 3D Structure • FVCOM • Generic • PTM | |
| Coastal Models: | ADCIRC • BOUSS-2D • CGWAVE • CMS-Flow • CMS-Wave • GenCade • STWAVE • WAM | |
| Riverine/Estuarine Models: | AdH • HEC-RAS • HYDRO AS-2D • RMA2 • RMA4 • SRH-2D • TUFLOW • TUFLOW FV | |
| Aquaveo • SMS Tutorials • SMS Workflows | ||


