SMS:WAM Simulation Model Control
The WAM Simulation Model Control can be accessed by right-clicking on the Simulation and selecting Model Control from the menu.
General Tab
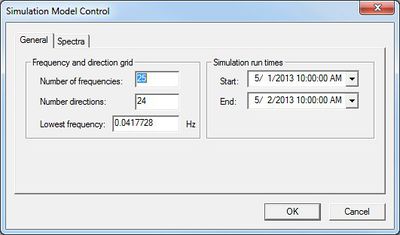
Starting Frequency Band
This is a very important parameter in WAM. Based on historical testing of the source terms (see Komen et al., 1994) there was a prescribed frequency range to tune the Discrete Interaction Approximation and the other source terms defined in the energy balance equation. This work used a starting frequency band of 0.04177248 Hz. Also the definition of the frequency band range is dictated by:
where
( is number of frequency bands)
For many application this starting frequency may be too high for the case of a large-oceanic scale domain like the Pacific Ocean where there is the potential for energy carrying frequencies lower than the designated threshold (i.e. 25-sec peak spectral wave periods, where wave period is the inverse of the frequency). Also, for small-scale fully enclosed bodies of water (i.e. the Great Lakes, reservoirs etc.) the range of wave frequencies is much higher, where the lowest frequency may be on the order of 0.0833-Hz (or 12-sec). The initial frequency value can be changed, upward or downward, as long as the range of frequency values can be defined from the 0.0417728-Hz standard. For the example of the Pacific Ocean implementation, a starting value of 0.03138428-Hz is used, where f(4) = 0.0417728-Hz as defined by the above equation. Setting a higher starting point for a Great Lakes simulation and knowledge of the wave climate an initial value could be 0.050545-Hz. Standard practices use conservatism allowing for energy to be transferred. Also, it is also advantageous to set the first frequency band high enough to minimize the computational time, where the propagation of wave energy is dictated by the group speed of the first frequency band. The lower the frequency, the shorter the stable propagation time step. The number of direction bands is nominally set to 24 or a 15-deg directional resolution of the wave spectra. Selection of a higher directional resolution (or increasing the number of directional bins) will linearly increase computational time because the directional loop is the outer-most loop in all of WAM’s calculations.
Simulation run times
The starting and ending time of the simulation must be entered in this section. The run times must be less or equal to the time available for wind data.
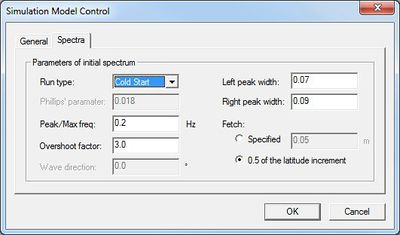
Spectra Tab
The parameters in the spectra tab with the exception of Fetch are Jonswap parameters.
Spectra Sites
Since the spectra data of every cell of the grid at each timestep would take an unreasonable amount of disk space, WAM writes spectra data at user specified cells. These cells are referred to as spectra sites and can be specified within the SMS interface. The spectra output can also be visualized on these cells.
Spectra sites can be made at any ocean cell on a Cartesian grid. To make a spectra site, select a cell on the desired Cartesian grid and change the cell attribute to Spectra Site and give it a name. If more than one cell is selected, then the name the spectra sites will receive is the name given concatenated with a number.
After WAM has run, and the spectra files have been read back into SMS, the spectral energy graph of the spectra sites may be viewed by right-clicking on the selected cell where the site is and selecting Spectral Energy. The spectra files may be read back into SMS by selecting the grid, and choosing Read Spectral Files from the WAM menu. The spectra files should be within the grid's folder within the simulation folder.
| [hide] SMS – Surface-water Modeling System | ||
|---|---|---|
| Modules: | 1D Grid • Cartesian Grid • Curvilinear Grid • GIS • Map • Mesh • Particle • Quadtree • Raster • Scatter • UGrid |  |
| General Models: | 3D Structure • FVCOM • Generic • PTM | |
| Coastal Models: | ADCIRC • BOUSS-2D • CGWAVE • CMS-Flow • CMS-Wave • GenCade • STWAVE • WAM | |
| Riverine/Estuarine Models: | AdH • HEC-RAS • HYDRO AS-2D • RMA2 • RMA4 • SRH-2D • TUFLOW • TUFLOW FV | |
| Aquaveo • SMS Tutorials • SMS Workflows | ||


