SMS:BOUSS Runup / Overtopping Viewing Data
Transect Profile
By using the plot wizard or by right-clicking on the simulation icon in the project explorer, there is the option to view the profile of an individual transect. Each arc in the simulation can be viewed by selecting the desired arc in the Transect arc list on the bottom left portion of the dialog. The bathymetry is displayed with the locations of probes and wavemakers. On a separate plot, the damping, roughness, and porosity can be viewed. This plot is for viewing purposes only.
Solution View
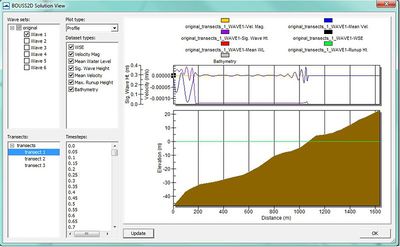
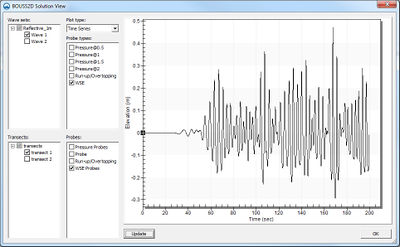
After running a simulation, the data can be viewed in the Solution dialog. This dialog can be accessed through the Plot Wizard. There are two different views in this dialog: Profile and Time Series.
Profile
This view is used to display the bathymetry with the following datasets if they were turned on in the model control: WSE, velocity magnitude, mean water level, significant wave height, mean velocity, and maximum runup height. A user can view the data for multiple wave sets for a single transect at the same time. Once the desired data is selected, clicking the Update button will refresh the plot window to show the selected data.
Time Series
The time series view displays the probe data from the simulation. In this view, the user can display the data for any combination of transects, wave cases, and probes.
Statistics
If a simulation has been run, the Statistics option will be available in the right-click menu for the simulation. This Statistics dialog will display various statistics for velocity, pressure, force, and water surface elevation probes on each transect.
The Time Series statistics display the following:
- Minimum – the minimum value in the time series
- Maximum – the maximum value in the time series
- Mean – the mean value for the time series
- Standard Deviation – the standard deviation for the time series
The Eta Zero-Crossing option displays:
- HAV – Average value of all peaks.
- H13 – Value exceeded by 1/3 of the peaks.
- H110 – Value exceeded by 1/10 of the peaks.
- HMAX – Maximum value of all peaks.
- TAV – Average period.
- T13 – Period exceeded by 1/3 of the peaks.
- T110 – Period exceeded by 1/10 of the peaks.
The Runup Statistics option displays:
- RMAX – Maximum value of all peaks.
- R2 – Value exceeded by 2% of peaks.
- R10 – Value exceeded by 10% of peaks.
- R33 – Value exceeded by 1/3 of peaks.
- RMEAN – Average of all peaks.
Related Topics
SMS – Surface-water Modeling System | ||
|---|---|---|
| Modules: | 1D Grid • Cartesian Grid • Curvilinear Grid • GIS • Map • Mesh • Particle • Quadtree • Raster • Scatter • UGrid |  |
| General Models: | 3D Structure • FVCOM • Generic • PTM | |
| Coastal Models: | ADCIRC • BOUSS-2D • CGWAVE • CMS-Flow • CMS-Wave • GenCade • STWAVE • WAM | |
| Riverine/Estuarine Models: | AdH • HEC-RAS • HYDRO AS-2D • RMA2 • RMA4 • SRH-2D • TUFLOW • TUFLOW FV | |
| Aquaveo • SMS Tutorials • SMS Workflows | ||

