Various images generated by GMS. Feel free to post your cool GMS-generated images here but only if you're OK with them being free and in the public domain. Please follow these guidelines when posting images.
Black background
All these images have the background color set to black.
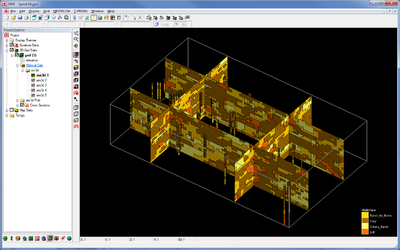
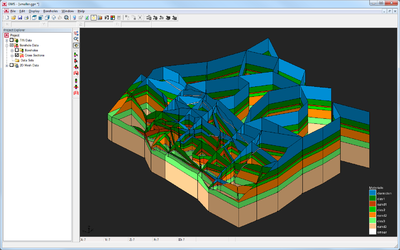
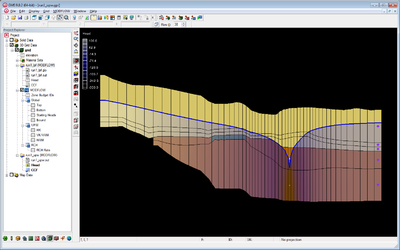
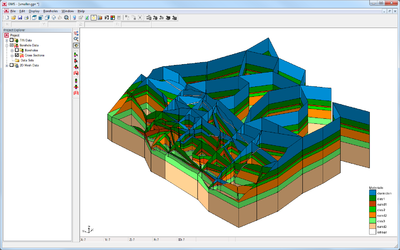
 Solid cross sections and boreholes. |
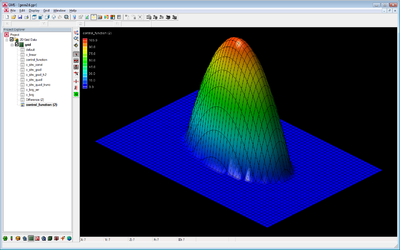 2D grid filled contours with an elliptical data set. |
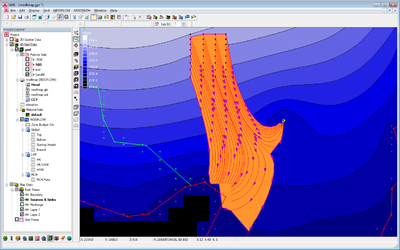
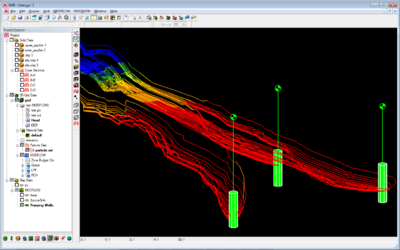
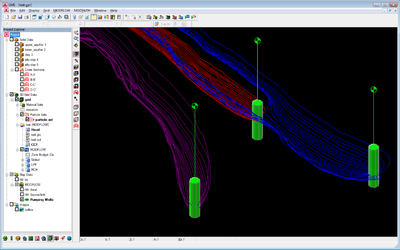 MODPATH pathlines around well screens in 3D. |
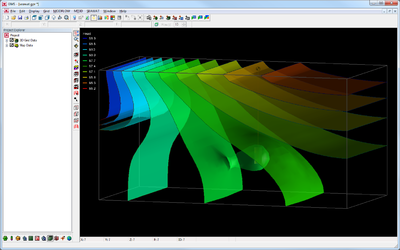
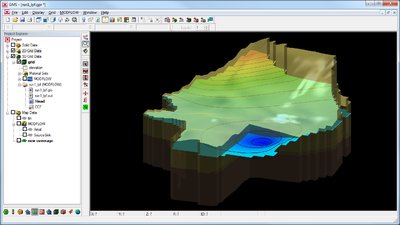
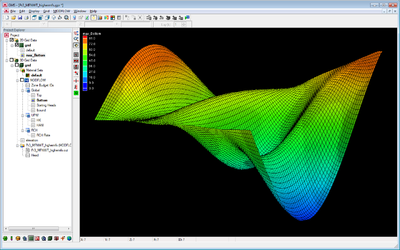
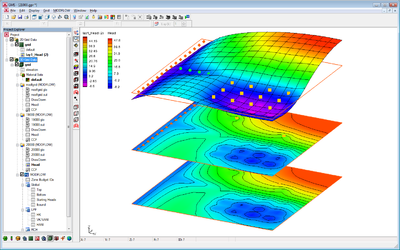
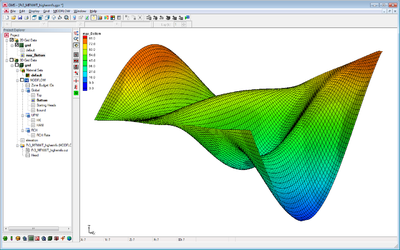
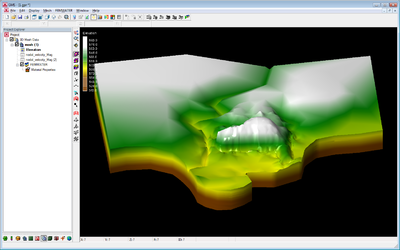 3D mesh with continuous contours using an elevation palette. |
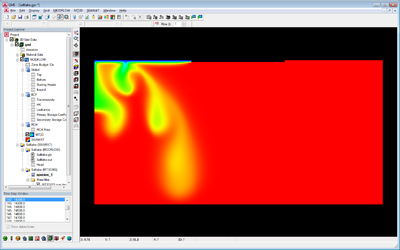 SEAWAT salt lake experiment showing salt water fingering. |
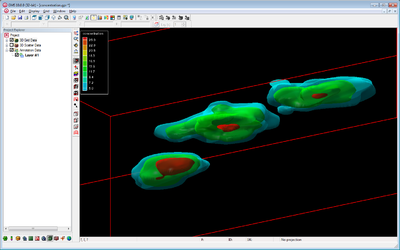
 Isosurface on a 3D grid and borehole sample data. |
 MODPATH pathlines from a landfill to a river and well. |
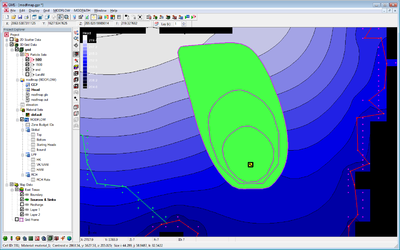 MODPATH nested capture zones at different times. |
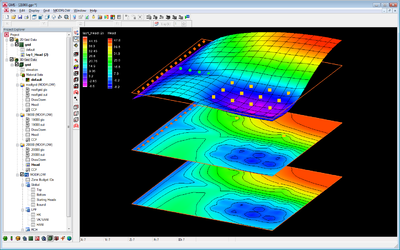 3D grid layer contours and a 2D grid in oblique view |
 Calibration targets and plots on a MODFLOW model. |
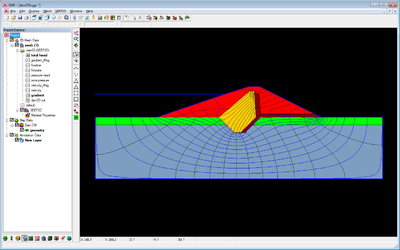
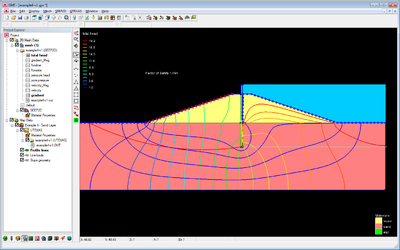
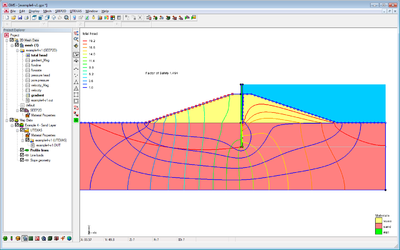
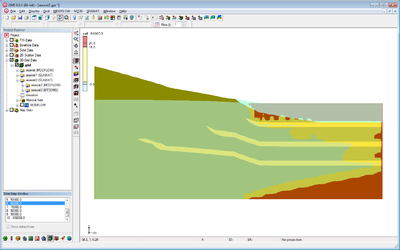
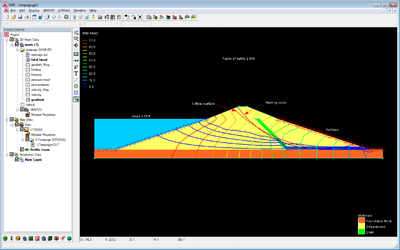 Profile of a dam with a flow net and critical surface. |
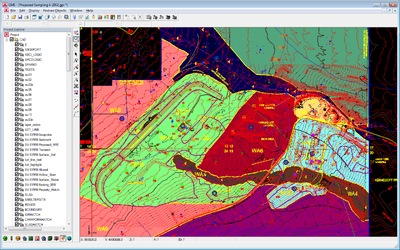 Complex CAD file rendered in GMS. |
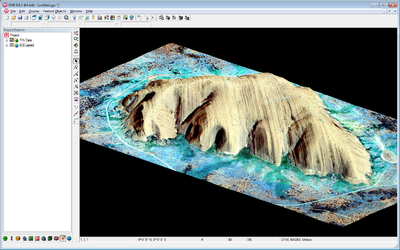
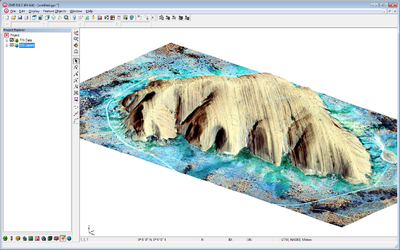
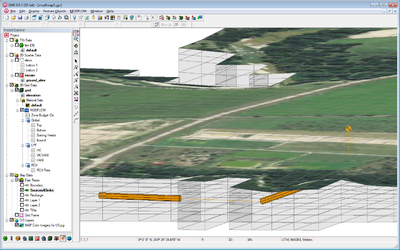
 LiDAR data of river and levee. |
|
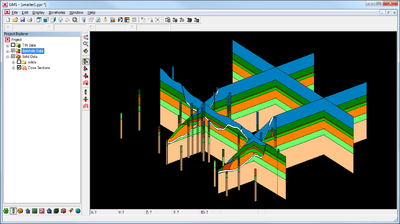
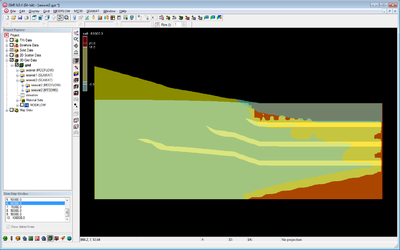
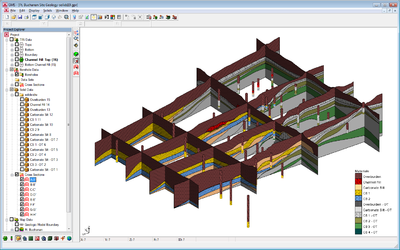
 Boreholes and cross-sections of TPROGS generated materials set. |
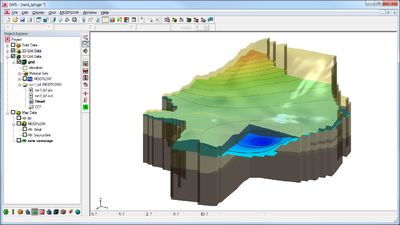
 Isosurfaces of MODFLOW computed heads. |
 Woburn site solids generated in GMS |
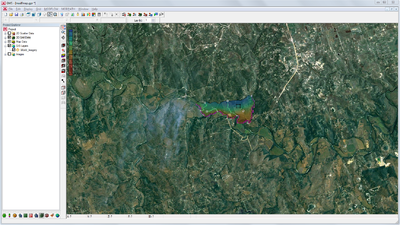 ESRI world imagery background map in GMS |
 MODFLOW computed water table in 3D. |
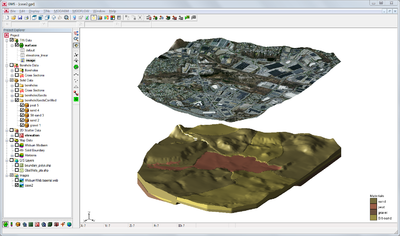
 Boreholes and cross sections from a solid model. |
 SEEP2D model of an earth dam. |
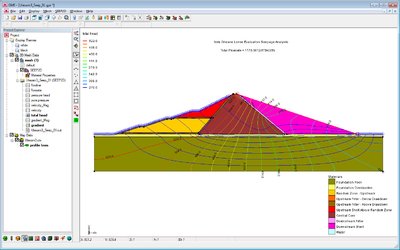
 SEEP2D model of Lost Lake dam. |
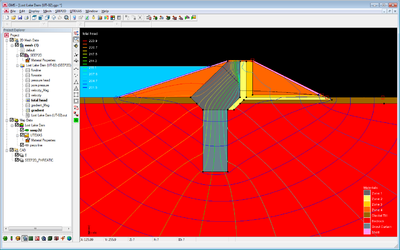
 SEEP2D model of a dam with a wall. |
 SEEP2D model of a complex dam. |
 MODPATH pathlines showing color by zone code display option. |
 Similar to image from MODFLOW-NWT documentation. |
 User-define cross sections to characterize a slope failure. |
 Ayers Rock - World imagery, ASTER GDEM elevations. |
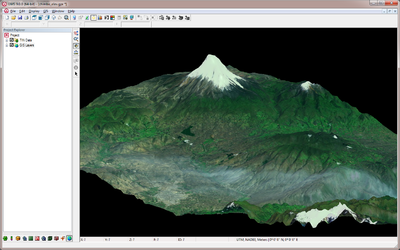 Mount Chimborazo - World imagery, ASTER GDEM elevations. |
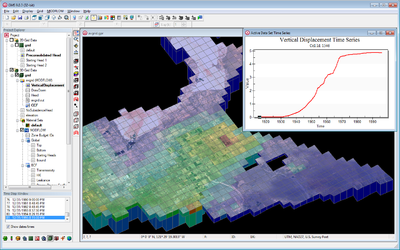 SUB package vertical displacement plot. |
|
|
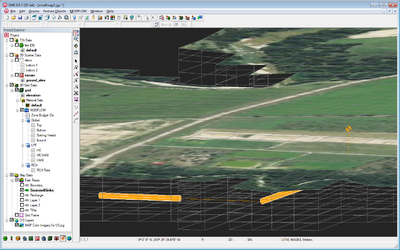 MNW2 Slanted and horizontal well screens. |
 MODFLOW model in side view with water table displayed. |
 MODFLOW model in side view with water table displayed. |
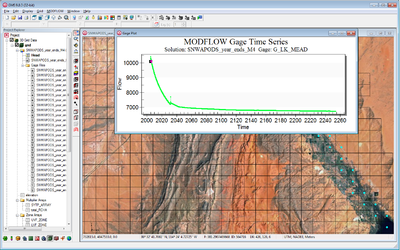 GAGE plot of SFR flow vs. time. |
 Isosurfaces of interpolated concentrations. |
 SEAWAT model of layered coastal aquifer. |
|
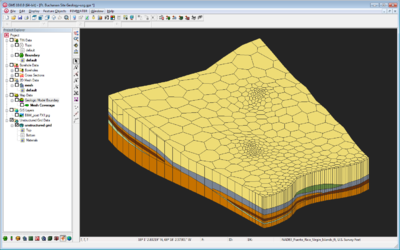 Horizons to voronoi unstructured grid. |
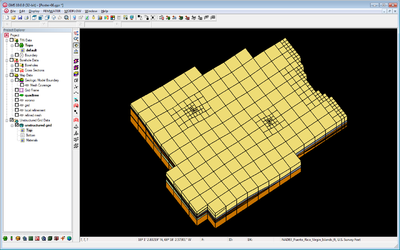 Horizons to quadtree unstructured grid. |
|
|
White background
Same as above but with the background color set to white.
 Solid cross sections and boreholes. |
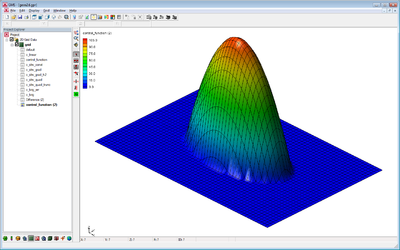 2D grid filled contours with an elliptical data set. |
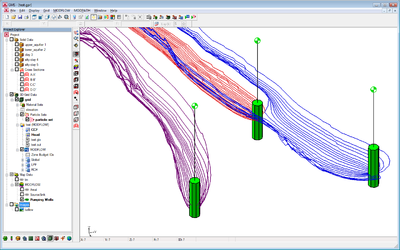 MODPATH pathlines around well screens in 3D. |
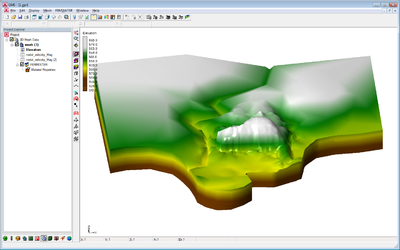 3D mesh with continuous contours using an elevation palette. |
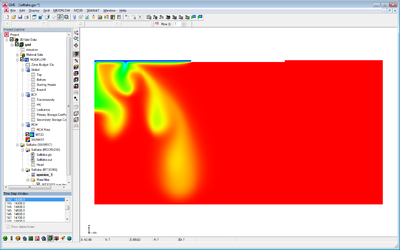 SEAWAT salt lake experiment showing salt water fingering. |
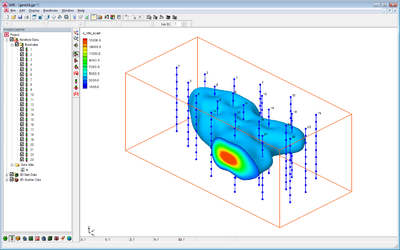 Isosurface on a 3D grid and borehole sample data. |
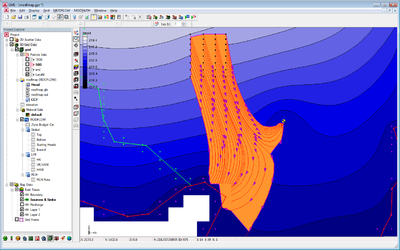 MODPATH pathlines from a landfill to a river and well. |
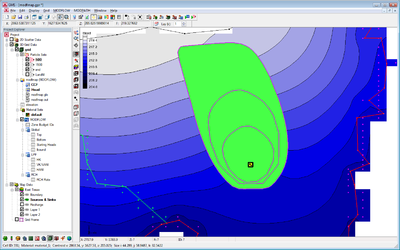 MODPATH nested capture zones at different times. |
 3D grid layer contours and a 2D grid in oblique view. |
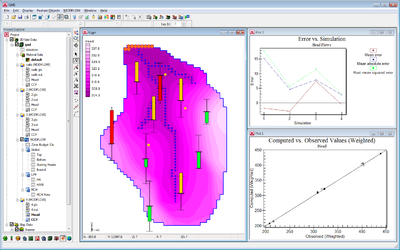 Calibration targets and plots on a MODFLOW model. |
 Profile of a dam with a flow net and critical surface. |
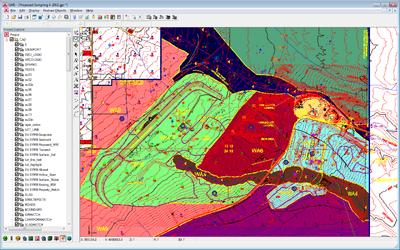 Complex CAD file rendered in GMS. |
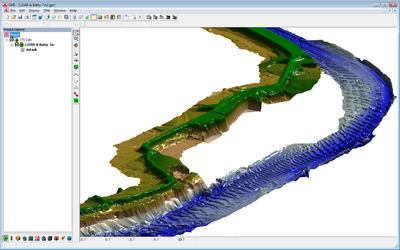 LiDAR data of river and levee. |
|
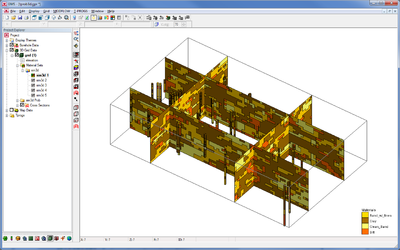 Boreholes and cross-sections of TPROGS generated materials set. |
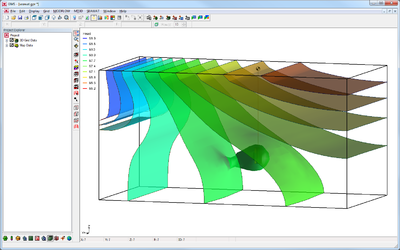 Isosurfaces of MODFLOW computed heads. |
 Woburn site solids generated in GMS |
ESRI world imagery background map in GMS |
 MODFLOW computed water table in 3D. |
 Boreholes and cross sections from a solid model. |
 SEEP2D model of an earth dam. |
 SEEP2D model of Lost Lake dam. |
 SEEP2D model of a dam with a wall. |
 SEEP2D model of a complex dam. |
 MODPATH pathlines showing color by zone code display option. |
 Similar to image from MODFLOW-NWT documentation. |
 User-defined cross sections to characterize a slope failure. |
 Ayers Rock - World imagery, ASTER GDEM elevations. |
 Mount Chimborazo - World imagery, ASTER GDEM elevations. |
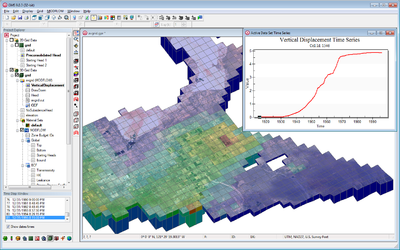 SUB package vertical displacement plot. |
|
|
 MNW2 Slanted and horizontal well screens. |
 MODFLOW model in side view with water table displayed. |
 MODFLOW model in side view with water table displayed. |
GAGE plot of SFR flow vs. time. |
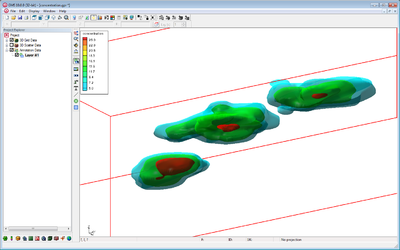 Isosurfaces of interpolated concentration. |
 SEAWAT model of layered coastal aquifer. |
|
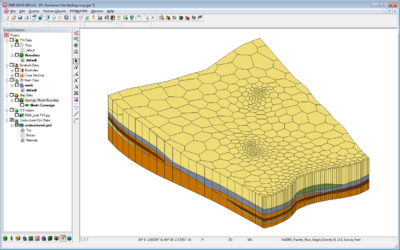 Horizons to voronoi unstructured grid. |
 Horizons to quadtree unstructured grid. |
|
|


