GMS:Borehole Display Options
From XMS Wiki
(Redirected from GMS:Boreholes Display Options)
Jump to navigationJump to search
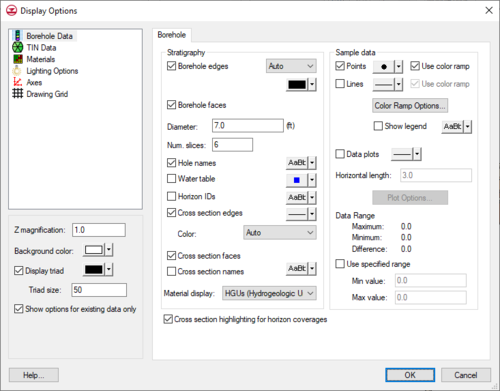
The properties of all borehole data that GMS displays on the screen can be controlled through the Borehole tab of the Display Options dialog. This dialog is opened by right-clicking on the Borehole Data ![]() entry in the Project Explorer and selecting the Display Options command. It can also be accessed from the from the Display menu or the Display Options
entry in the Project Explorer and selecting the Display Options command. It can also be accessed from the from the Display menu or the Display Options ![]() macro. The following table describes the display options available for the Borehole module.
macro. The following table describes the display options available for the Borehole module.
| Display Option | Description |
|---|---|
| Borehole edges | This option controls the display of the lines that show the outline of the boreholes. The color of the borehole edges can be adjusted according to the following options:
|
| Borehole faces | Displays borehole segments as filled polygons. |
| Diameter | This value determines the display size of the boreholes in the graphics window in world length coordinates. |
| Num. slices | This edit field determines the number of slices to display for the borehole. The default is 6 making the boreholes display as hexagons. |
| Hole names | Displays the name of each hole at the top of the hole. |
| Water table | Displays an icon representing the water table at the water table elevation of each borehole. The water table elevation can be adjusted for each borehole in the Borehole Editor. |
| Horizon IDs | The Horizon IDs option controls the display of the horizon id next to each borehole contact. |
| Cross sections edges | Three options are available for the cross section edges:
|
| Cross section faces | Cross section segments display as filled polygons. |
| Cross section names | Cross section names display above the cross sections. |
| Material display | This radio group determines the display color of the boreholes. The borehole segments can be colored either by the Soil or HGU assigned. |
| Cross Section Highlighting for Horizon Coverages | Displays the lines showing the part of the cross sections where the material with the horizon ID of the active horizon coverage exists. This highlighting only appears when in plan view and the active coverage is a horizon coverage. |
| Points | Displays every sample data point. If the Use color ramp box is checked, the points are colored according to the current dataset and the current color ramp settings. |
| Lines | Connects sample points by a series of line segments. If the Use color ramp box is checked, the line segments are colored according to the current dataset and the current color ramp settings. When the Show legend box is checked, a legend appears for the sample data. |
| Data plots | Draws a plot of the current dataset next to each borehole with sample data. The width (horizontal length) can be adjusted and the options associated with the plot scale, plot axes, etc., can be accessed by selecting the Plot Options button. |
| Data range | By default, the minimum color on the color ramp is associated with the minimum dataset value and the maximum color is associated with the maximum dataset value. The ramp of colors can be confined to a smaller interval defined by the Maximum and Minimum values. This forces all of the color gradation to be concentrated in a particular range of interest. |
| GMS – Groundwater Modeling System | ||
|---|---|---|
| Modules: | 2D Grid • 2D Mesh • 2D Scatter Point • 3D Grid • 3D Mesh • 3D Scatter Point • Boreholes • GIS • Map • Solid • TINs • UGrids | |
| Models: | FEFLOW • FEMWATER • HydroGeoSphere • MODAEM • MODFLOW • MODPATH • mod-PATH3DU • MT3DMS • MT3D-USGS • PEST • PHT3D • RT3D • SEAM3D • SEAWAT • SEEP2D • T-PROGS • ZONEBUDGET | |
| Aquaveo | ||

