GMS:Contour Options
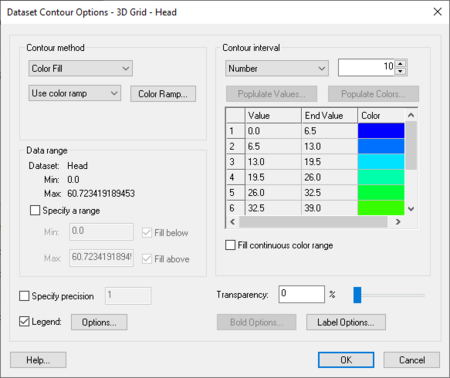
The options used to generate contours can be edited by selecting the Contour Options command in the Display menu. The contour options are related to a specific dataset or geometry. Changing the contour options for one does not necessarily change the contour options for others. The name of the dataset or geometry whose contours are being edited appears at the top of the dialog. Check which contour options are being edited before beginning to avoid confusion. To change which item's options are being edited, select the desired item in the Project Explorer. The items in the Contour Options dialog are as follows:
Contour Method
There are 3 main types of contours: linear, color filled, and both linear and color filled. The first drop-down menu in this section has those three options and one option that gets used occasionally. The option selected from this menu affects the availability of other features in this dialog.
- Linear – The default method is Normal linear contours and causes the contours to be displayed as piece-wise linear strings.
- Color Fill – If the Color fill between contours option is selected, the region between adjacent contour lines is filled with a solid color. There is also a smooth option available. When this option is turned on the color between contour lines varies according to the color ramp. The transparency of the filled contours can also be adjusted by adjusting the Transparency option near the bottom right corner of the dialog.
- Linear and Color Fill – This option shows linear contours on top of color filled contours.
- Block Fill – This option applies only to cell centered grids. Cells are filled with a single color. The color chosen corresponds to the color ramp value associated with the value at the cell center.
The options in the second drop-down menu change the color scheme of the contours. These options change based on the type of contour selected in the first drop-down menu.
- Specify each color – Option to specify the color for each interval of contours. Specify the colors in the table in the Contour interval section of this same dialog. Also possible to use Populate Colors... button to specify colors automatically.
- Use color ramp – Uses a color ramp to specify contour color at each contour interval. Pressing the Color Ramp… button will open the Color Options dialog.
- Single color – The contour lines will all be a single color. This option is only available when the "Linear" contour type is selected.
The following options appear depending on the selection of contour method. They appear below the two drop-down menus in this section.
- Line thickness – Sets thickness of the contour lines. Only available when the "Linear" contour method is selected.
- Line color – Clicking the line button opens a Line Properties dialog that allows for setting the color, width, and style (solid or dashed) of the line. Clicking the arrow allows for simply adjusting the color options. Only available when the "Linear and Color Fill" contour method is selected.
Data Range
The values shown in the Data range section correspond to the maximum and minimum values in the active dataset. These values are sometimes useful when choosing an appropriate contour interval.
- Specify a range – Regardless of which option is selected for the contour interval, a maximum and a minimum contour value can be specified and the contouring can be restricted to the specified range. If desired, the fill below or fill above options can be turned on to color fill above/below the specified range.
- Specify precision – This option is just below the Data range section. The number entered here specifies how many decimal places appear in the numerical values in Data range and in Contour interval.
Contour Interval
The contour interval defines the values associated with the contours. Based on the option selected, the contour values are computed and displayed in the spreadsheet. The colors assigned to each of the contour values are also displayed
Three main options are provided for defining contour intervals in the Contour Options dialog. A fourth is available only when the "Block Fill" option is selected in the Contour method section. The options are as follows:
- Number – When selected, an integer is entered representing the total number of contours. The contour interval is adjusted based on the current active dataset so that the contours are evenly spaced and the number of contours corresponds exactly to the specified value.
- Specified Interval – Directly specifies the contour interval (5, 10, 20, etc.).
- Specified Values – Allows entering a list of specific contour values in the spreadsheet below. Contours are only generated at these values. The number of specified values can be set in the box to the left of the Contour interval drop-down menu.
- Unique Values – Creates a contour value that corresponds to the value of each cell on a cell-centered grid. Assigns a unique color to each of them. Only available when "Block Fill" option is selected in Contour method section.
The other options in this section become available based on selections in the Contour interval and Contour method sections of this dialog. These options are as follows:
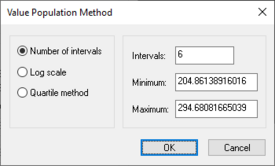
- Poplulate Values – This button opens the Value Population Method dialog, which has options for determining how to specify the values that will have contours assigned to them. Available when the "Specified Values" option is selected in the Contour interval section.
- Populate Colors – Opens a Color Options dialog for automatically populating the colors if desired. Available when the "Specify each color" option is selected in the Contour method section.
- Fill continuous color range – Option to blend color-filled contours into each other. Results in more gradual visual transitions between contours. When turned off, color-filled contours are clearly delineated; the contours show only the colors assigned to contour values with no blending. Available when the "Color Fill" and "Color Fill and Linear" options are selected in the Contour method section.
Value Population Method
- Number of intervals – Option to populate the values in the spreadsheet by setting the desired number of intervals and the minimum and maximum values. Generates contour values for the given number of intervals. Automatically turns on the Specify a range option in the Data range section.
- Log scale – Sets contour values to numbers on a logarithmic scale.
- Quartile method – Sets contour values according to how the data divides into quartiles.
- Intervals – Sets the desired number of intervals for contour values.
- Minimum – Sets the minimum value for the contour values.
- Maximum – Sets the maximum value for the contour values.
Contour Legend Options
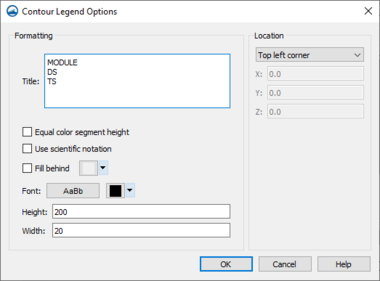
The Contour Legend Options controls the formatting and location of a displayed legend. If a contour dataset exists and is displayed, the legend is shown if the Legend check box on the Contour Display Options dialog is checked. This dialog is accessed from the Legend Options button on the Contour Options dialog.
The dialog has the following options:
- Formatting – The Formatting section includes fields for the title displayed with the legend, a Font selection button for text style, and Height and Width fields for legend size.
- Title – Since contour datasets can be displayed for multiple modules at the same time and, therefore, multiple contour legends can be displayed, the Title field can include keywords for convenient labeling. The following title keywords are case sensitive:
- "MODULE" – will be replaced with the title of the contour dataset's module
- "DS" – will be replaced with the name of the currently selected contour dataset
- "DS:TS" – will be replaced with the name of the currently selected contour dataset followed by the current time step
- A title of "MODULE DS:TS" is best since it will automatically update as contour dataset selection changes.
- Equal color segment height – Used with the "Specified valued" option in the Contour Options dialog to make the legend segment height equal to number of interval values. This is often used when using logarithmic intervals for the contour interval.
- Use scientific notation – Changes the displayed legend values to use scientific notation. This will only be apparent with certain datasets.
- Fill behind – Fills in the area behind the legend with a specified color. Clicking the button next to this option will bring up a "Select Color" dialog where the fill color can be selected.
- Font – Clicking the buttons next to this option can bring up the Select font or the Select Color dialogs respectively that can be used to adjust the text display of the legend.
- Height – Enter value to set the height of the legend.
- Width – Enter value to set the width of the legend.
- Title – Since contour datasets can be displayed for multiple modules at the same time and, therefore, multiple contour legends can be displayed, the Title field can include keywords for convenient labeling. The following title keywords are case sensitive:
- Location – The Location section includes a combo box for specifying the location of the displayed legend. The locations include:
- "Top left corner"
- "Bottom left corner"
- "Top right corner"
- "Bottom right corner"
- "Screen location" – specify the location based on screen percentages.
- "World location" – specify the coordinate location.
Bold Options
Bold Options – Opens the Bold Options dialog, which allows for displaying contours with a thicker line width at selected intervals.
Contour Labels
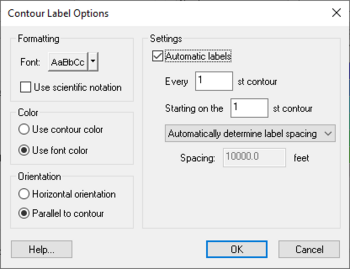
The Label Options button in the Contour Options dialog is used to access the Contour Label Options dialog. This dialog is used to set the label font, color, and orientation (whether the labels follow the contours or are simply horizontal). Use the Settings section to set the spacing used when the labels are generated automatically. The default spacing value controls the placement of labels when labels are generated automatically.
Labels can be added to contours in one of two ways:
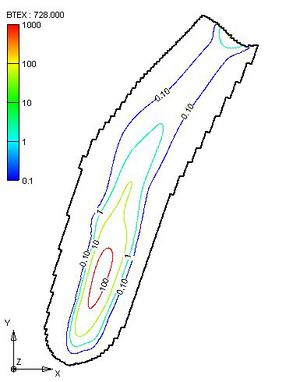
- If the contour label option is selected in the Contour Options dialog, labels are automatically placed on the contours. The spacing of the labels is controlled with the Contour Labels dialog.
- In some modules, contour labels can be added manually to contours by selecting the Contour Labels tool in the Tool Palette and clicking on the contours where labels are desired. The value drawn using this tool gives the exact value of the point clicked. The number of decimals displayed can be adjusted using the Specify precision tool in the Dataset Contour Options dialog. Labels added manually follow the font and color settings from the Contour Label Options dialog. However, orientation settings are ignored for manually added labels.
Specified Dataset
Specify the dataset with the Select Dataset... button in the 3D Grid Data tab of the Display Options dialog. This brings up a new window where the specified dataset is selected. The contour options available for the specified dataset are the same as the active dataset options, yet each must be established separately. This option is useful in comparing datasets.
GMS – Groundwater Modeling System | ||
|---|---|---|
| Modules: | 2D Grid • 2D Mesh • 2D Scatter Point • 3D Grid • 3D Mesh • 3D Scatter Point • Boreholes • GIS • Map • Solid • TINs • UGrids | |
| Models: | FEFLOW • FEMWATER • HydroGeoSphere • MODAEM • MODFLOW • MODPATH • mod-PATH3DU • MT3DMS • MT3D-USGS • PEST • PHT3D • RT3D • SEAM3D • SEAWAT • SEEP2D • T-PROGS • ZONEBUDGET | |
| Aquaveo | ||
