GMS:Isosurfaces
Isosurface rendering is a powerful tool for visualizing 3D datasets. Isosurfaces can be generated for 3D grids and 3D meshes. An isosurface is the 3D equivalent of a contour line. While a contour line is a line of constant value extracted from a surface, an isosurface is a surface of constant value extracted from a 3D dataset.
Defining Isovalues
Isosurfaces are computed using the active scalar dataset for the grid or mesh. The Isosurface Options dialog is accessed through the Isosurface Options command in the Grid menu or through a button in the 3D Grid Display Options or 3D Mesh Display Options dialogs. The items in the Isosurface Options dialog are as follows:
Active Dataset
At the top of the dialog the active scalar dataset and active time step is listed. The maximum and minimum dataset values are also listed.
Isovalues
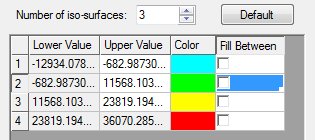
In the next section of the dialog the number of isosurfaces and the isovalues are defined. A maximum of 12 isosurfaces may be created. The Default button can be used to automatically set up a number of isovalues. For example, if the number of isosurfaces is three and the button is selected, three isovalues, equally spaced between the maximum and minimum dataset values are generated.
Fill Between
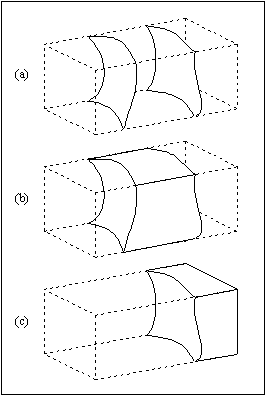
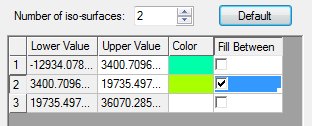
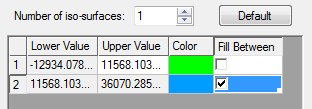
The Fill Between boxes to the right of the isovalues are used to generate surfaces on the exterior of the mesh or grid between two isovalues. For example, in part (a) of the figure shown below, two isosurfaces have been generated using two isovalues. The image shown in part (b) was computed using the same isovalues and with the Fill Between box checked similar to figure (d) below. This causes the region of the mesh or grid boundary between the two isovalues to be defined as surfaces. The image shown in part (c) was generated using a single isovalue with the Fill Between box checked on the line after the isovalue like figure (e). This causes the boundary with dataset values greater than the specified value to be defined as surfaces.
Isosurfaces (a) No Fill (b) Fill Between Two Isovalues (c) Fill Above or Below an Isovalue (d) Filling between 2 isosurfaces (e) Filling above an isosurface.
Transparency
Transparency can be specified for each Isosurface. Transparency affects the display of isosurface faces.
Define as Cross-Section
Like contour lines, isosurfaces are temporary in nature. In other words, if the active dataset is changed, the current isosurfaces are deleted and new isosurfaces are computed using the new dataset values. In some cases, it is useful to create an isosurface as a permanent object. This can be accomplished by selecting the Define as Cross-section option in the Isosurface Options dialog. This causes the computed isosurfaces to be treated as cross sections. As cross sections, these isosurfaces can be saved to a file, hidden, or deleted. In addition, if a new dataset is selected, the isosurfaces are not deleted. In fact, the values associated with the new dataset are interpolated to the cross section isosurfaces and can be displayed on the isosurfaces as color fringes or contours. This makes it possible to effectively display two datasets at once.
Interior Edge Removal
By default, whenever an isosurface is computed from a mesh or a grid, the lines corresponding to the intersection of the isosurface with the cell or element boundaries are displayed on the isosurfaces. If the Interior edge removal option is selected, only the edges on the isosurface corresponding to a feature angle break greater than the specified value are displayed on the isosurface. For example, if the feature angle were set at 30.00 degrees, the angle formed by the two polygonal faces adjacent to each edge in the isosurface would be checked and only those edges where the computed angle is less than 180 - 30 = 150 degrees would be displayed. Typically, a small value (e.g., 0.001) is used so that only the edges adjacent to two coplanar faces are removed (made invisible).
Visible Region Only Option
If the Compute for visible region only option is chosen, the isosurfaces are not computed in regions where the cells or elements are not visible. Otherwise, isosurfaces are computed for all regions of the mesh or grid.
Isosurface Edges
If this option is on, the lines that make up the isosurface are displayed.
Isosurface Faces
If this option is on, the isosurface is displayed a color-filled surface.
Specify Range
The Contour specified range command allows controlling the minimum and maximum value used to define the colors assigned to the isosurfaces.
Isosurface Volumes
The volume within an isosurface or the volume between two isosurfaces is computed using the Isosurface Volume command in the Grid menu. This command brings up a dialog with a list of isovalues and volumes. The listed isovalues correspond to the isovalues defined in the Isosurface Options dialog. The listed volumes represent the volumes between each of the isovalues. For example, the first volume represents the volume below (on the "low" side of) the lowest isovalue, the second volume represents the volume between the first and second isovalues, etc. The total volume listed at the bottom of the dialog should correspond to the total volume of the grid or mesh.
Beginning with GMS 7.0 the Isosurface Volumes dialog has changed to display a single volume associated with each isosurface. In addition to showing a single volume, it also possible to view the volume of the cells (or elements) that are less than the isovalue, the volume of the cells that are greater than the isovalue, and the volume of the cells intersected by the isosurface by turning on the Display additional volume information toggle. In some cases GMS is unable to compute the volume of the isosurface. In those cases there is still an estimate of the isosurface volume by looking at the volume of the cells. The volume of the cells should be close to the volume of the isosurface when the grid (or mesh) is composed of very "small" cells. The difference between the isosurface volume and the volume of the cells decreases as the size of the cells decreases.
See also
| [hide] GMS – Groundwater Modeling System | ||
|---|---|---|
| Modules: | 2D Grid • 2D Mesh • 2D Scatter Point • 3D Grid • 3D Mesh • 3D Scatter Point • Boreholes • GIS • Map • Solid • TINs • UGrids | |
| Models: | FEFLOW • FEMWATER • HydroGeoSphere • MODAEM • MODFLOW • MODPATH • mod-PATH3DU • MT3DMS • MT3D-USGS • PEST • PHT3D • RT3D • SEAM3D • SEAWAT • SEEP2D • T-PROGS • ZONEBUDGET | |
| Aquaveo | ||


