GMS:Vectors
If the Vectors item in the Display Options dialog is selected for an object (TIN, Grid, or Mesh), vector plots can be generated using the active vector dataset for the object. One vector is placed at each node, cell, or vertex.
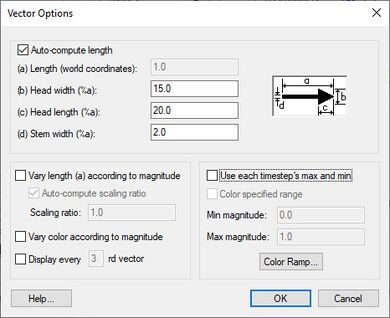
To open this dialog, click the Options button to the right of Vectors on any Display Options tab with a Vectors option. The options in this dialog determine the settings for vector display for every geometry that might use vectors. The dialog options are as follows:
Dimensions
When the Auto compute length option is on, GMS computes the length of the vectors. When it is off, the Length can be edited. The edit fields labeled Length, Head width, Head length, and Stem width control the size and shape of the vectors. The Head width, Head length, and Stem width are expressed as a percentage of the length of the vector.
Vary Length and/or Color
Often it is desirable to vary the display of the vectors according to the magnitude of the vector function at a current point. This can be done with the Vary length according to magnitude and Vary color according to magnitude. If the Vary length according to magnitude option is selected, each vector is displayed with a length equal to the magnitude of the vector multiplied by the Scaling ratio. If the Vary color according to magnitude option is selected, the vectors with the smallest and largest magnitude are drawn in the color of the lowest and highest colors on the current color ramp. All other vectors are drawn in a color which corresponds to its magnitude from the current color ramp.
Display Every Nth Vector
If the Display every _nth vector is selected, only every nth vector is drawn. This is useful when the model is so large that drawing every vector clutters the display.
Color Specified Range
“Use each timestep’s max and min” applies when vectors are colored according to a color ramp and the active vector dataset has more than one time step. It displays the maximum and minimum magnitude for the active time step as the highest and lowest colors on the color ramp. When it is off, the maximum and minimum magnitudes for the entire dataset display as the highest and lowest colors on the color ramp. It is also possible to have the current color ramp vary over a specified range of the active vector dataset. This is done by selecting the Color specified range option and editing the Min magnitude and Max magnitude edit fields.
2D vs. 3D Vectors
If in one of the orthogonal views (xy plane, xz plane, yz plane), the vectors display as 2D vectors. If in oblique view, the vectors display as 3D vectors.
See also
GMS – Groundwater Modeling System | ||
|---|---|---|
| Modules: | 2D Grid • 2D Mesh • 2D Scatter Point • 3D Grid • 3D Mesh • 3D Scatter Point • Boreholes • GIS • Map • Solid • TINs • UGrids | |
| Models: | FEFLOW • FEMWATER • HydroGeoSphere • MODAEM • MODFLOW • MODPATH • mod-PATH3DU • MT3DMS • MT3D-USGS • PEST • PHT3D • RT3D • SEAM3D • SEAWAT • SEEP2D • T-PROGS • ZONEBUDGET | |
| Aquaveo | ||
