GMS:Boreholes: Difference between revisions
From XMS Wiki
Jump to navigationJump to search
(→Stratigraphy: Noted bottom of boreholes is considered no-flow zone) |
|||
| (2 intermediate revisions by the same user not shown) | |||
| Line 2: | Line 2: | ||
The Borehole module of GMS can be used to visualize boreholes created from drilling logs or synthetic boreholes created manually and to construct three-dimensional [[GMS:Borehole Cross Sections|cross sections]] between boreholes. These cross sections show the soil stratigraphy between two boreholes. | The Borehole module of GMS can be used to visualize boreholes created from drilling logs or synthetic boreholes created manually and to construct three-dimensional [[GMS:Borehole Cross Sections|cross sections]] between boreholes. These cross sections show the soil stratigraphy between two boreholes. | ||
Borehole data can be [[GMS:Creating and Editing Boreholes|imported or created]] in GMS. The borehole module contains its own set of [[GMS:Borehole Tool Palette|tools]] and [[GMS:Borehole Commands|commands]] for manipulating borehole data as well as its own display options. Borehole data can be [[GMS:Converting Borehole Data|converted]] to other types of objects such as 2D | Borehole data can be [[GMS:Creating and Editing Boreholes|imported or created]] in GMS. The borehole module contains its own set of [[GMS:Borehole Tool Palette|tools]] and [[GMS:Borehole Commands|commands]] for manipulating borehole data as well as its own display options. Borehole data can be [[GMS:Converting Borehole Data|converted]] to other types of objects such as 2D scatter points, TINs, 3D meshes. | ||
The module also allows using [[GMS:Borehole Hydrogeologic Units|hydrogeologic units (HGUs)]] to be defined on boreholes. | The module also allows using [[GMS:Borehole Hydrogeologic Units|hydrogeologic units (HGUs)]] to be defined on boreholes. | ||
The Borehole | The Borehole module can be added to a [http://www.aquaveo.com/software/gms-pricing paid edition] of GMS. | ||
[[Category:Link to Store]] | [[Category:Link to Store]] | ||
| Line 15: | Line 15: | ||
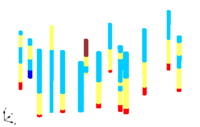
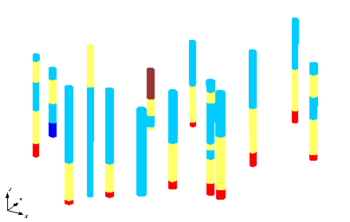
Stratigraphy data are used to represent soil layers that are encountered in a soil boring. The soil layers are represented using contacts and segments as shown below. A segment represents a soil layer and a contact is the interface between two segments. GMS assumes no-flow bedrock below the bottom of each borehole when generating the stratigraphy. | Stratigraphy data are used to represent soil layers that are encountered in a soil boring. The soil layers are represented using contacts and segments as shown below. A segment represents a soil layer and a contact is the interface between two segments. GMS assumes no-flow bedrock below the bottom of each borehole when generating the stratigraphy. | ||
[[Image:Holes1.png|thumb|none|350 px|Boreholes representing soil stratigraphy with contacts and segments]] | :[[Image:Holes1.png|thumb|none|350 px|Boreholes representing soil stratigraphy with contacts and segments]] | ||
===Sample Data=== | ===Sample Data=== | ||
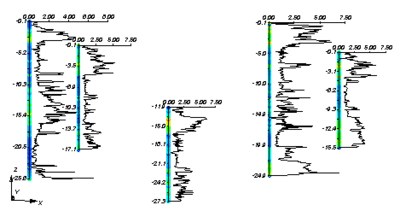
Sample data represent data obtained by continuous sampling along the length of the hole. Cone penetrometer data or down-hole geophysical data like permeability are examples of sample data. The figure below shows an example of sample data being displayed. Sample data are stored in datasets which can be displayed and manipulated in a similar fashion as other datasets in GMS. To display the sample data the display options for the | Sample data represent data obtained by continuous sampling along the length of the hole. Cone penetrometer data or down-hole geophysical data like permeability are examples of sample data. The figure below shows an example of sample data being displayed. Sample data are stored in datasets which can be displayed and manipulated in a similar fashion as other datasets in GMS. To display the sample data the display options for the borehole data can be modified such that the ''Sample data'' points and data plots are checked as visible while the borehole edges are hidden in the ''Display Options'' dialog. | ||
[[Image:Sampledata1.png|thumb|none|400 px|Boreholes with sample data]] | :[[Image:Sampledata1.png|thumb|none|400 px|Boreholes with sample data]] | ||


