|
|
| (4 intermediate revisions by the same user not shown) |
| Line 4: |
Line 4: |
| 2D grids are primarily used for surface visualization and [[GMS:Contour Options|contouring]]. This is accomplished by [[GMS:Interpolation|interpolating]] to the grid. The figure below is an example of interpolating contaminant concentration data to a 2D grid. | | 2D grids are primarily used for surface visualization and [[GMS:Contour Options|contouring]]. This is accomplished by [[GMS:Interpolation|interpolating]] to the grid. The figure below is an example of interpolating contaminant concentration data to a 2D grid. |
|
| |
|
| {|
| | <gallery mode="packed" heights="250 px"> |
| |-
| | Image:grid_interp.png|Concentration data interpolated to a 2D grid |
| |valign="top"|[[Image:grid_interp.png|thumb|none|300 px|Concentration data interpolated to a 2D grid]]
| | Image:Sample_water_table.png|Watertable elevations from a MODFLOW simulation |
| |[[Image:Sample_water_table.png|thumb|none|300 px|Watertable elevations from a MODFLOW simulation]]
| | </gallery> |
| |}
| |
|
| |
|
| ==2D Grid Types== | | ==2D Grid Types== |
| Line 17: |
Line 16: |
| Grids in GMS are Cartesian grids. That is, the row and column spacing in the grid can vary, but the row and column boundaries are straight. Each cell center or grid node can have a unique elevation. The grid can also be rotated about the Z axis if desired. | | Grids in GMS are Cartesian grids. That is, the row and column spacing in the grid can vary, but the row and column boundaries are straight. Each cell center or grid node can have a unique elevation. The grid can also be rotated about the Z axis if desired. |
|
| |
|
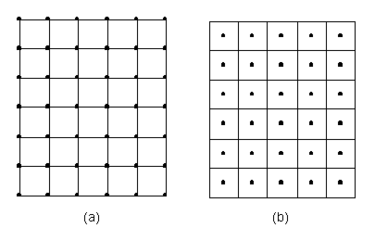
| [[Image:GridType1.png|thumb|none|375 px|Types of 2D grids supported in GMS. (a) Mesh-centered grid (b) Cell-centered grid.]] | | :[[Image:GridType1.png|thumb|none|375 px|Types of 2D grids supported in GMS. (a) Mesh-centered grid (b) Cell-centered grid.]] |
| | |
|
| |
|
| ==See also== | | ==See also== |
| Line 26: |
Line 24: |
| {{Navbox GMS}} | | {{Navbox GMS}} |
| [[Category:2D Grid]] | | [[Category:2D Grid]] |
| | | [[Category:Grid Modules]] |
| {{stub}}
| | [[Category:Gallery]] |
| <!--This is a landing page. The information that is here is useful, but there's not enough content to make it worth the reader's time.-->
| |
The 2D Grid module is used for creating and editing two-dimensional Cartesian grids. A number of tools are provided for working with 2D grids. Currently, GMS only allows one 2D grid per project.
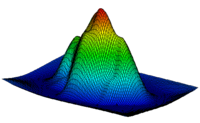
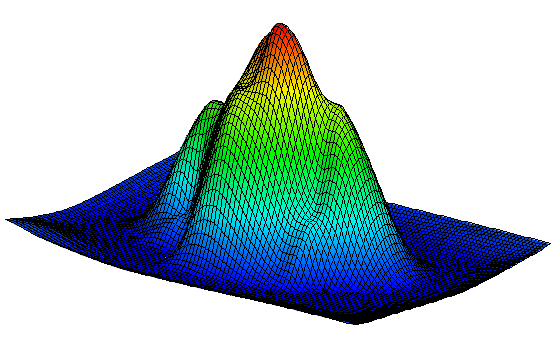
2D grids are primarily used for surface visualization and contouring. This is accomplished by interpolating to the grid. The figure below is an example of interpolating contaminant concentration data to a 2D grid.
Concentration data interpolated to a 2D grid
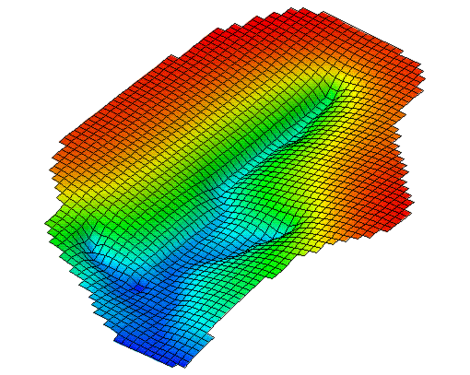
Watertable elevations from a MODFLOW simulation
2D Grid Types
Two types of grids are supported in the 2D Grid module: mesh-centered grids and cell-centered grids. With a mesh-centered grid, the data values are stored at the corners of the grid cells. With a cell-centered grid, data values are stored at the cell centers.
When a dataset is imported to a cell-centered grid, there is one value in the dataset for each cell. The contouring and fringing functions use scalar values at the cell corners. Therefore, whenever contouring or fringing is performed, the values at the cell centers are interpolated to the cell corners. Interpolation to cell corners is only done for visualization purposes. All computations performed using the data calculator are performed on the original values at the cell centers. With mesh-centered grids, all visualization and computations are performed at the cell corners and no interpolation is necessary.
Grids in GMS are Cartesian grids. That is, the row and column spacing in the grid can vary, but the row and column boundaries are straight. Each cell center or grid node can have a unique elevation. The grid can also be rotated about the Z axis if desired.

Types of 2D grids supported in GMS. (a) Mesh-centered grid (b) Cell-centered grid.
See also


