SMS:Raster Module: Difference between revisions
No edit summary |
|||
| (23 intermediate revisions by 2 users not shown) | |||
| Line 1: | Line 1: | ||
{{SMS Deprecated Feature}} | |||
{{SMS at a glance raster module|Heading===At a glance==}} | {{SMS at a glance raster module|Heading===At a glance==}} | ||
Starting with SMS 12.0, rasters are managed in SMS as objects in the GIS module. All previous functionality is available on raster entities in that module. | |||
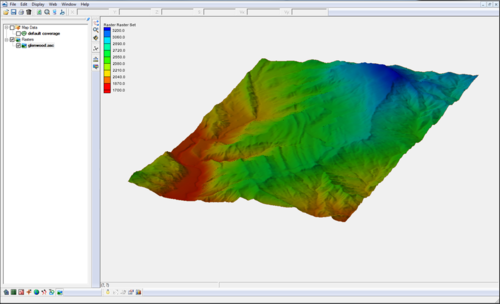
Rasters contain data (usually elevation) stored in pixels. Their resolution can vary, depending on the number of x and y cells the raster contains. The Raster Module allows | |||
Rasters contain data (usually elevation) stored in pixels. Their resolution can vary, depending on the number of x and y cells the raster contains. The Raster Module allows opening and visualizing rasters of various formats and convert them into TIN (scatter sets), and interpolate their data into scatter sets, 2D meshes, and 2D grids. | |||
The Raster module is included with all [http://www.aquaveo.com/software/sms-pricing paid editions] of SMS. | |||
[[Category:Link to Store]] | |||
==Raster Sets== | ==Raster Sets== | ||
Each raster will be stored in a raster set. A raster set may contain multiple rasters. Ofter the data in one raster is also associated to another raster, when each raster is used to cover an area. When this is the case, | Each raster will be stored in a raster set. A raster set may contain multiple rasters. Ofter the data in one raster is also associated to another raster, when each raster is used to cover an area. When this is the case, group the rasters together under a single raster set. Raster sets are used in doing interpolation and plotting. | ||
A new raster set can be created by right clicking on the root raster item in the | A new raster set can be created by right-clicking on the root raster item [[File:Raster Folder.svg|16 px]] in the Project Explorer, then select '''New Raster Set'''. Existing raster's can be moved into a raster set by simply dragging the raster into the raster set. | ||
==Raster Display Options== | |||
[[File:RasterDisplayOptions.png|thumb|350 px|Example of the ''Raster Display Options'' dialog]] | |||
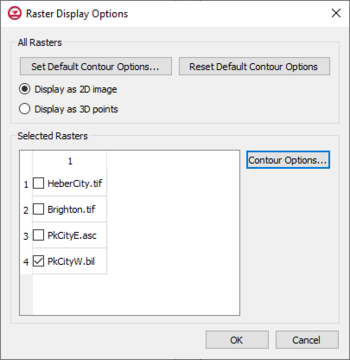
The ''Raster Display Options'' dialog is used to change the way rasters are displayed. This dialog is accessed by right-clicking on a raster file in the Project Explorer and selecting the '''Display Options''' command. | |||
DEMs are imported and displayed as either 2D images or as a 3D point cloud. | |||
The ''Raster Display Options'' dialog has the following options: | |||
*'''Set Default Contour Options''' – This button will open a ''Contour Options'' dialog that will set contour options for all raster files in the project. Clicking the '''Color Ramp''' button in the ''Contour Options'' dialog will open the ''Color'' dialog. When accessing the ''Color'' dialog through this process, the differnet shader options are available. | |||
*'''Reset Default Contour Options''' – Clicking this will restore the contour options to the default options/factory condition. | |||
*''Display as 2D Image'' – If displaying as a 2D image, the raster is only visible in plan view (like other images). This option is fast and memory efficient and can support large rasters (or several rasters). Hill shading, which enables shadows and thus makes the image appear 3D, is available in this mode. | |||
*''Display as 3D Points'' – If displaying as 3D points, the raster is visible in any view, not just plan view. 3D points are also very memory efficient but may be a little slower than the 2D image option. Also, hill shading is not available in this mode. The point size and the maximum number of points to display can be specified. Specifying a maximum number of points can be useful if the size of the raster is such that rendering becomes slow. | |||
*''Selected Rasters'' – This list will show all rasters that have been imported into the project. | |||
**''Contour Options''' – This button will open a ''Contour Options'' dialog that will set contour options for the selected raster files in the project. Clicking the '''Color Ramp''' button in the ''Contour Options'' dialog will open the ''Color'' dialog. When accessing the ''Color'' dialog through this process, the differnet shader options are available. | |||
===Shaders=== | |||
With either 2D or 3D, four different shaders, which control the color ramp, are available. A color legend can be displayed to relate colors with values. | |||
==Related Topics== | |||
* [[SMS:Raster Module Interface|Raster Module Interface]] | |||
* [[SMS:Raster Functionalities|Raster Functionalities]] | |||
* [[Raster Options]] | |||
{{Navbox SMS}} | {{Navbox SMS}} | ||
[[Category:Raster|R]] | |||
[[Category:SMS GIS]] | |||
[[Category:External Links]] | |||
[[Category:Archived]] | |||
Latest revision as of 19:11, 16 April 2021
| This contains information about features no longer in use for the current release of SMS. The content may not apply to current versions. |
At a glance
NOTE: the functionality of this module was incorporated into the GIS module starting with SMS version 12.0
- Open and visualize raster data
- Supports many gridded elevation file formats. A complete list can be found at: www.globalmapper.com/product/formats.htm
- One or more rasters are placed under a raster set in the Project Explorer.
- Convert raster to TIN (scatter set)
- Interpolate data from raster to TINs /2D mesh/2D grid
- Use rasters with observation profile plots
Starting with SMS 12.0, rasters are managed in SMS as objects in the GIS module. All previous functionality is available on raster entities in that module.
Rasters contain data (usually elevation) stored in pixels. Their resolution can vary, depending on the number of x and y cells the raster contains. The Raster Module allows opening and visualizing rasters of various formats and convert them into TIN (scatter sets), and interpolate their data into scatter sets, 2D meshes, and 2D grids.
The Raster module is included with all paid editions of SMS.
Raster Sets
Each raster will be stored in a raster set. A raster set may contain multiple rasters. Ofter the data in one raster is also associated to another raster, when each raster is used to cover an area. When this is the case, group the rasters together under a single raster set. Raster sets are used in doing interpolation and plotting.
A new raster set can be created by right-clicking on the root raster item ![]() in the Project Explorer, then select New Raster Set. Existing raster's can be moved into a raster set by simply dragging the raster into the raster set.
in the Project Explorer, then select New Raster Set. Existing raster's can be moved into a raster set by simply dragging the raster into the raster set.
Raster Display Options
The Raster Display Options dialog is used to change the way rasters are displayed. This dialog is accessed by right-clicking on a raster file in the Project Explorer and selecting the Display Options command.
DEMs are imported and displayed as either 2D images or as a 3D point cloud.
The Raster Display Options dialog has the following options:
- Set Default Contour Options – This button will open a Contour Options dialog that will set contour options for all raster files in the project. Clicking the Color Ramp button in the Contour Options dialog will open the Color dialog. When accessing the Color dialog through this process, the differnet shader options are available.
- Reset Default Contour Options – Clicking this will restore the contour options to the default options/factory condition.
- Display as 2D Image – If displaying as a 2D image, the raster is only visible in plan view (like other images). This option is fast and memory efficient and can support large rasters (or several rasters). Hill shading, which enables shadows and thus makes the image appear 3D, is available in this mode.
- Display as 3D Points – If displaying as 3D points, the raster is visible in any view, not just plan view. 3D points are also very memory efficient but may be a little slower than the 2D image option. Also, hill shading is not available in this mode. The point size and the maximum number of points to display can be specified. Specifying a maximum number of points can be useful if the size of the raster is such that rendering becomes slow.
- Selected Rasters – This list will show all rasters that have been imported into the project.
- Contour Options' – This button will open a Contour Options dialog that will set contour options for the selected raster files in the project. Clicking the Color Ramp button in the Contour Options dialog will open the Color dialog. When accessing the Color dialog through this process, the differnet shader options are available.
Shaders
With either 2D or 3D, four different shaders, which control the color ramp, are available. A color legend can be displayed to relate colors with values.
Related Topics
SMS – Surface-water Modeling System | ||
|---|---|---|
| Modules: | 1D Grid • Cartesian Grid • Curvilinear Grid • GIS • Map • Mesh • Particle • Quadtree • Raster • Scatter • UGrid |  |
| General Models: | 3D Structure • FVCOM • Generic • PTM | |
| Coastal Models: | ADCIRC • BOUSS-2D • CGWAVE • CMS-Flow • CMS-Wave • GenCade • STWAVE • WAM | |
| Riverine/Estuarine Models: | AdH • HEC-RAS • HYDRO AS-2D • RMA2 • RMA4 • SRH-2D • TUFLOW • TUFLOW FV | |
| Aquaveo • SMS Tutorials • SMS Workflows | ||

