SMS:Observation Profile Plot: Difference between revisions
No edit summary |
|||
| (21 intermediate revisions by 4 users not shown) | |||
| Line 1: | Line 1: | ||
A ''Profile plot'' is used to display the variation of one or more scalar datasets associated with a mesh or grid along observation arcs in the Observation Coverage. Profile plots are created in the ''Plot Wizard'' dialog by selecting ''Observation Profile'' from the plot type list. When an arc is selected two small arrows appear at either end of the arc. These arrows indicate the viewing direction for the plots. To change the viewing direction select the arc and execute the ''Feature Objects'' | '''Reverse Arc Direction''' command. A sample plot is shown in the figure below. | A ''Profile plot'' is used to display the variation of one or more scalar datasets associated with a mesh or grid along observation arcs in the [[SMS:Observation Coverage|Observation coverage]]. Profile plots are created in the ''Plot Wizard'' dialog by selecting ''Observation Profile'' from the plot type list. Profile plots can also be created by right-clicking on an observation arc and selecting '''Show Observation Plot''' which will generate the profile plot using the selected arc. | ||
When an arc is selected two small arrows appear at either end of the arc. These arrows indicate the viewing direction for the plots. To change the viewing direction select the arc and execute the ''Feature Objects'' | '''Reverse Arc Direction''' command. A sample plot is shown in the figure below. | |||
[[Image:ProfilePlot.png|thumb|none|500 px|A plot showing a cross section view of a river channel]] | [[Image:ProfilePlot.png|thumb|none|500 px|A plot showing a cross section view of a river channel]] | ||
== Profile Plot Options == | == Profile Plot Options == | ||
After the plot type is set in Step 1 of the ''Plot Wizard'', the profile plot options need to be defined. The following options must be set for a profile plot: | [[File:Plot Data Options.png|thumb|400 px|Example of the ''Plot Data'' dialog]] | ||
After the plot type is set in Step 1 of the ''Plot Wizard'', the profile plot options need to be defined in step 2. The following options must be set for a profile plot: | |||
=== Coverage === | === Coverage === | ||
A profile plot | A profile plot generates plots at locations defined in a single observation type coverage. One plot may contain multiple plots for multiple locations. However, locations (arcs or lines) defined in separate observations coverages cannot be combined into a single plot. The following coverage related options are available: | ||
* ''Coverage'' – If multiple observation type coverages exist, the coverage to use for the profile plot must be selected. | * ''Coverage'' – If multiple observation type coverages exist in a session of SMS, the coverage to use for the selected profile plot must be selected. A [[SMS:Plot_Data_Coverage|Plot Data coverage]] may be used to define annotation objects that can be incorporated into a plot. | ||
* ''Extraction method'' | * ''Extraction method'' | ||
** ''Model Intersections'' – Profile plot points are based on intersections of the specified feature arcs and element, cell, or triangle edges. | |||
* ''Model Intersections'' – Profile plot points are based on intersections of the specified feature arcs and element, cell, or triangle edges. | ** ''Points and Vertices'' – Profile plot points are interpolated at the location of points and vertices on the specified feature arcs. | ||
* ''Points and Vertices'' – Profile plot points are interpolated at the location of points and vertices on the specified feature arcs. | |||
=== Dataset === | === Dataset === | ||
* ''Active dataset'' – Profile plot points are based on the active dataset. The profile plot will update when the active dataset is changed. | * ''Active dataset'' – Profile plot points are based on the active dataset. The profile plot will update when the active dataset is changed. | ||
** ''Module'' – Since each module contains an active dataset, when using the active dataset option, the module must be specified. | |||
* ''Module'' – Since each module contains an active dataset, when using the active dataset option, the module must be specified. | |||
* ''Specified dataset(s)'' – Profile plot points are based on the specified dataset(s). Datasets from different modules can be specified. | * ''Specified dataset(s)'' – Profile plot points are based on the specified dataset(s). Datasets from different modules can be specified. | ||
| Line 29: | Line 28: | ||
*''Use selected dataset and time step'' – This option causes the plot to display the values of one or more specified datasets or time steps for each arc being plotted. Changing the active dataset does not affect the plot. Check the check-box of the dataset that will be viewed from the list box. | *''Use selected dataset and time step'' – This option causes the plot to display the values of one or more specified datasets or time steps for each arc being plotted. Changing the active dataset does not affect the plot. Check the check-box of the dataset that will be viewed from the list box. | ||
===Components=== | |||
* A [[SMS:3D Bridge|3D bridge]] may be used in conjunction with an observation plot. By selecting the desired 3D Bridge coverage in the plot options, the cross section of the bridge created by intersecting the observation arc with the 3D bridge will be displayed in the observation plot. | |||
== Plotting With Multiple Arcs Selected == | == Plotting With Multiple Arcs Selected == | ||
| Line 36: | Line 38: | ||
Multiple observation arcs can also be plotted to look continuous if they are part of an arc group by following these steps: | Multiple observation arcs can also be plotted to look continuous if they are part of an arc group by following these steps: | ||
* Create a profile arc that composed of more than one arc (this means the arcs must be connected at the end points and start points) | * Create a profile arc that is composed of more than one arc (this means the arcs must be connected at the end points and start points) | ||
* Choose the menu command ''Feature Objects'' | '''Create Arc Group''' | * Choose the menu command ''Feature Objects'' | '''Create Arc Group''' | ||
* Create the observation profile plot like before by using the ''Plot Wizard'' | * Create the observation profile plot like before by using the ''Plot Wizard'' | ||
| Line 42: | Line 44: | ||
[[Image:Plot4.JPG|none|600 px]] | [[Image:Plot4.JPG|none|600 px]] | ||
==Practical Notes== | |||
When using an observation profile plot, keep the following in mind: | |||
* When viewing a profile plot from an observation arc, the data values on the observation arc are interpolated values. In some cases, such as with SRH-2D solutions, this data has already been interpolated and is being interpolated again from the observation arc. | |||
* The finest level of detail that an observation arc can examine in a plot is the size of a mesh/grid element. | |||
==Observation Profile Troubleshooting== | |||
If a plot will not generate or does not display significant data, it's possible that the conditions for the plot have not been set up correctly. To get a meaningful plot, take the following into account: | |||
* This plot requires an observation coverage with an arc included. If there is more than one observation coverage, ensure the correct observation coverage is selected on step 2 of the ''Plot Wizard''. The arc in the observation coverage needs to cross through a geometry or a scatter dataset with the dataset intended for visualization attached. If the plot is not showing significant data, it could be that the observation arc is not passing through a geometry or scatter set with any data from the dataset selected in the Project Explorer. | |||
* This plot requires datasets. If the simulation does not have datasets, then this plot will not have significant results. This plot can represent many kinds of datasets, including elevation and solution scalar datasets. | |||
* The dataset desired for visualization should be selected in the Project Explorer. Which dataset is selected affects what displays in the plot. If the active dataset is not appearing in the plot when it is selected in the Project Explorer, make sure that the "Active" option is selected in the ''Dataset(s)'' section of Step 2 of the ''Plot Wizard''. Furthermore, ensure that the ''Module'' drop-down menu is set to the correct module. For example, if the module is set to "Scatter", selecting datasets associated with the mesh in the Project Explorer will not change the plot. | |||
* The time step desired for visualization should be selected either in the Time steps window at the bottom of the Project Explorer or on step 2 of the ''Plot Wizard''. If the active time step is not appearing in the plot when it is selected in the Project Explorer, make sure that the "Active" option is selected in the ''Time Step(s)'' section of Step 2 of the ''Plot Wizard''. | |||
* Certain coverages can be shown. If the coverage isn't appearing in the plot window, check on step 2 of the ''Plot Wizard'' under ''Show Intersections'' and make sure that the box in the ''Show'' column is checked. | |||
== Related Topics == | == Related Topics == | ||
* [[SMS:Plot Window|Plot Window]] | * [[SMS:Plot Window|Plot Window]] | ||
* [[SMS:Observation Coverage|Observation Coverage]] | |||
Latest revision as of 20:39, 18 April 2022
A Profile plot is used to display the variation of one or more scalar datasets associated with a mesh or grid along observation arcs in the Observation coverage. Profile plots are created in the Plot Wizard dialog by selecting Observation Profile from the plot type list. Profile plots can also be created by right-clicking on an observation arc and selecting Show Observation Plot which will generate the profile plot using the selected arc.
When an arc is selected two small arrows appear at either end of the arc. These arrows indicate the viewing direction for the plots. To change the viewing direction select the arc and execute the Feature Objects | Reverse Arc Direction command. A sample plot is shown in the figure below.
Profile Plot Options
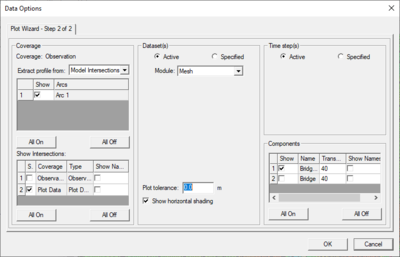
After the plot type is set in Step 1 of the Plot Wizard, the profile plot options need to be defined in step 2. The following options must be set for a profile plot:
Coverage
A profile plot generates plots at locations defined in a single observation type coverage. One plot may contain multiple plots for multiple locations. However, locations (arcs or lines) defined in separate observations coverages cannot be combined into a single plot. The following coverage related options are available:
- Coverage – If multiple observation type coverages exist in a session of SMS, the coverage to use for the selected profile plot must be selected. A Plot Data coverage may be used to define annotation objects that can be incorporated into a plot.
- Extraction method
- Model Intersections – Profile plot points are based on intersections of the specified feature arcs and element, cell, or triangle edges.
- Points and Vertices – Profile plot points are interpolated at the location of points and vertices on the specified feature arcs.
Dataset
- Active dataset – Profile plot points are based on the active dataset. The profile plot will update when the active dataset is changed.
- Module – Since each module contains an active dataset, when using the active dataset option, the module must be specified.
- Specified dataset(s) – Profile plot points are based on the specified dataset(s). Datasets from different modules can be specified.
Time step
- Active time step – Profile plot points are based on the active time step. The profile plot will update when the active time step is changed.
- Specified time step – Profile plot points are based on the specified time step.
- Use active dataset and time step – This option causes the plot to display the values of the active dataset and time step for each arc being plotted. When the active dataset changes, the plot is recomputed and updated.
- Use selected dataset and time step – This option causes the plot to display the values of one or more specified datasets or time steps for each arc being plotted. Changing the active dataset does not affect the plot. Check the check-box of the dataset that will be viewed from the list box.
Components
- A 3D bridge may be used in conjunction with an observation plot. By selecting the desired 3D Bridge coverage in the plot options, the cross section of the bridge created by intersecting the observation arc with the 3D bridge will be displayed in the observation plot.
Plotting With Multiple Arcs Selected
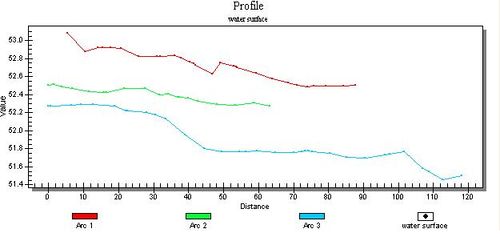
There are two ways in which an observation profile can be created when multiple arcs will be graphed. Multiple arcs can be graphed on a single plot was so they appear in separate segments as shown below.
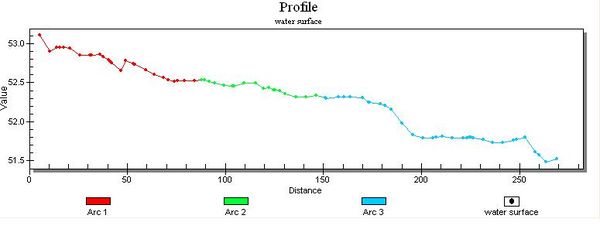
Multiple observation arcs can also be plotted to look continuous if they are part of an arc group by following these steps:
- Create a profile arc that is composed of more than one arc (this means the arcs must be connected at the end points and start points)
- Choose the menu command Feature Objects | Create Arc Group
- Create the observation profile plot like before by using the Plot Wizard
When the plot is generated, it will look as shown below where the line is continuous. The different arcs are drawn in their respective colors, but are linked together end to end.
Practical Notes
When using an observation profile plot, keep the following in mind:
- When viewing a profile plot from an observation arc, the data values on the observation arc are interpolated values. In some cases, such as with SRH-2D solutions, this data has already been interpolated and is being interpolated again from the observation arc.
- The finest level of detail that an observation arc can examine in a plot is the size of a mesh/grid element.
Observation Profile Troubleshooting
If a plot will not generate or does not display significant data, it's possible that the conditions for the plot have not been set up correctly. To get a meaningful plot, take the following into account:
- This plot requires an observation coverage with an arc included. If there is more than one observation coverage, ensure the correct observation coverage is selected on step 2 of the Plot Wizard. The arc in the observation coverage needs to cross through a geometry or a scatter dataset with the dataset intended for visualization attached. If the plot is not showing significant data, it could be that the observation arc is not passing through a geometry or scatter set with any data from the dataset selected in the Project Explorer.
- This plot requires datasets. If the simulation does not have datasets, then this plot will not have significant results. This plot can represent many kinds of datasets, including elevation and solution scalar datasets.
- The dataset desired for visualization should be selected in the Project Explorer. Which dataset is selected affects what displays in the plot. If the active dataset is not appearing in the plot when it is selected in the Project Explorer, make sure that the "Active" option is selected in the Dataset(s) section of Step 2 of the Plot Wizard. Furthermore, ensure that the Module drop-down menu is set to the correct module. For example, if the module is set to "Scatter", selecting datasets associated with the mesh in the Project Explorer will not change the plot.
- The time step desired for visualization should be selected either in the Time steps window at the bottom of the Project Explorer or on step 2 of the Plot Wizard. If the active time step is not appearing in the plot when it is selected in the Project Explorer, make sure that the "Active" option is selected in the Time Step(s) section of Step 2 of the Plot Wizard.
- Certain coverages can be shown. If the coverage isn't appearing in the plot window, check on step 2 of the Plot Wizard under Show Intersections and make sure that the box in the Show column is checked.
Related Topics
SMS – Surface-water Modeling System | ||
|---|---|---|
| Modules: | 1D Grid • Cartesian Grid • Curvilinear Grid • GIS • Map • Mesh • Particle • Quadtree • Raster • Scatter • UGrid |  |
| General Models: | 3D Structure • FVCOM • Generic • PTM | |
| Coastal Models: | ADCIRC • BOUSS-2D • CGWAVE • CMS-Flow • CMS-Wave • GenCade • STWAVE • WAM | |
| Riverine/Estuarine Models: | AdH • HEC-RAS • HYDRO AS-2D • RMA2 • RMA4 • SRH-2D • TUFLOW • TUFLOW FV | |
| Aquaveo • SMS Tutorials • SMS Workflows | ||


