User:Rcorrigan/AHGW Pro:Time Series Grapher: Difference between revisions
No edit summary |
No edit summary |
||
| Line 1: | Line 1: | ||
__NOINDEX__ | __NOINDEX__ | ||
[[File:ArcGIS Pro Time Series Grapher.png|thumb|350px|right|The ''Time Series Grapher'' pane]] | [[File:ArcGIS Pro Time Series Grapher.png|thumb|350px|right|The ''Time Series Grapher'' pane]] | ||
In ArcGIS Pro, the ''Time Series Grapher'' tool is accessed by selecting '''Time Series Grapher''' from the Arc Hydro Groundwater ribbon. | In ArcGIS Pro, the ''Time Series Grapher'' tool is accessed by selecting '''Time Series Grapher''' from the ''Arc Hydro Groundwater'' ribbon. | ||
:'''''ArcGIS Notes''''' – In ArcGIS, the ''Time Series Grapher Setup'' dialog is accessed by selecting ''Arc Hydro GW'' | '''Time Series Grapher Setup''' from the [[AHGW:Arc Hydro Groundwater Toolbar|Arc Hydro Groundwater Toolbar]]. | :'''''ArcGIS Notes''''' – In ArcGIS, the ''Time Series Grapher Setup'' dialog is accessed by selecting ''Arc Hydro GW'' | '''Time Series Grapher Setup''' from the [[AHGW:Arc Hydro Groundwater Toolbar|Arc Hydro Groundwater Toolbar]]. | ||
:The names of the fields in this tool might be different in ArcGIS. They should still be recognizable. | :The names of the fields in this tool might be different in ArcGIS. They should still be recognizable. | ||
This tool has the following sections, options, and buttons: | |||
*''Features'' section | *''Features'' section | ||
**''Layer'' – Select the desired layer from the drop-down. | **''Layer'' – Select the desired layer from the drop-down. | ||
**[[File:Arcgispro Slct.png|16 px]] – | **[[File:Arcgispro Slct.png|16 px]] – Once all the desired settings have been specified, select this icon to activate the tool. Once the tool is active, select features (e.g. wells), and the tool will produce plots of the time series data associated with the selected features. The plot appears in the ''Contents'' pane under the ''Standalone Tables'' section under a ''Charts'' heading. Double-click on the items that appear under ''Charts'' to view the time series plots that have been generated using the tool. | ||
**''Unique ID Field'' – Select the unique ID field from the drop-down. | **''Unique ID Field'' – Select the unique ID field from the drop-down. | ||
*''Time Series'' section | *''Time Series'' section | ||
| Line 14: | Line 14: | ||
**''Date/Time Field'' – Select the field containing date/time data from the drop-down. | **''Date/Time Field'' – Select the field containing date/time data from the drop-down. | ||
**''Value Field'' – Select the desired value from the drop-down. | **''Value Field'' – Select the desired value from the drop-down. | ||
**''Enable Filtering by Variable ID'' – | **''Enable Filtering by Variable ID'' – Enables filtering according to the following options: | ||
***''Variable ID Field'' – Select from the drop-down the field containing the variable ID. | ***''Variable ID Field'' – Select from the drop-down the field containing the variable ID. | ||
***''Variable ID'' – Select the desired variable ID from the drop-down. | ***''Variable ID'' – Select the desired variable ID from the drop-down. | ||
| Line 27: | Line 27: | ||
The Time Series Grapher tool automates the creation of time series plots (e.g. groundwater levels, concentrations). The tool is an interactive tool that allows users to click on features and plot related time series data. The user first sets up the tool by specifying certain options. | The Time Series Grapher tool automates the creation of time series plots (e.g. groundwater levels, concentrations). The tool is an interactive tool that allows users to click on features and plot related time series data. The user first sets up the tool by specifying certain options. | ||
Once the setup is complete the user can click on features in the map to create the plot of associated time series. | Once the setup is complete, the user can click on features in the map to create the plot of associated time series. See the documentation next to the [[File:Arcgispro Slct.png|16 px]] icon to learn how this works in ArcGIS Pro. | ||
[[File:AHGW TimeSeries Grapher2.png|thumb|400px|none|The Time Series Grapher tool automates the process of creating time | [[File:AHGW TimeSeries Grapher2.png|thumb|400px|none|The Time Series Grapher tool automates the process of creating time series plots. When the tool is activated selecting a feature automatically generates the requested plot.]] | ||
series plots. When the tool is activated selecting a feature automatically generates the requested plot.]] | |||
{{Navbox AHGW}} | {{Navbox AHGW}} | ||
[[Category:AHGW Groundwater Analyst]] | [[Category:AHGW Groundwater Analyst]] | ||
Revision as of 19:51, 25 August 2022
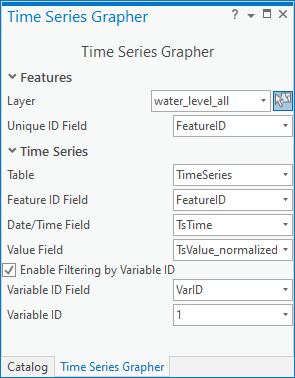
In ArcGIS Pro, the Time Series Grapher tool is accessed by selecting Time Series Grapher from the Arc Hydro Groundwater ribbon.
- ArcGIS Notes – In ArcGIS, the Time Series Grapher Setup dialog is accessed by selecting Arc Hydro GW | Time Series Grapher Setup from the Arc Hydro Groundwater Toolbar.
- The names of the fields in this tool might be different in ArcGIS. They should still be recognizable.
This tool has the following sections, options, and buttons:
- Features section
- Layer – Select the desired layer from the drop-down.
 – Once all the desired settings have been specified, select this icon to activate the tool. Once the tool is active, select features (e.g. wells), and the tool will produce plots of the time series data associated with the selected features. The plot appears in the Contents pane under the Standalone Tables section under a Charts heading. Double-click on the items that appear under Charts to view the time series plots that have been generated using the tool.
- Unique ID Field – Select the unique ID field from the drop-down.
- Time Series section
- Table – Select the desired table from the drop-down.
- Feature ID Field – Select the field containing the feature identifier from the drop-down.
- Date/Time Field – Select the field containing date/time data from the drop-down.
- Value Field – Select the desired value from the drop-down.
- Enable Filtering by Variable ID – Enables filtering according to the following options:
- Variable ID Field – Select from the drop-down the field containing the variable ID.
- Variable ID – Select the desired variable ID from the drop-down.
- ArcGIS Feature Note – The documentation for the following option applies only to older versions of ArcGIS, not to ArcGIS Pro.
- OK – Save changes and close the Time Series Grapher Setup dialog.
Examples
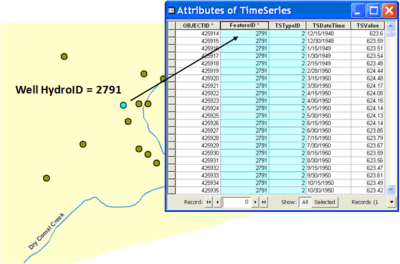
Analysis of time series data (e.g. water quality, water levels, discharge, etc.) is an important part of hydrologic analysis. Arc Hydro provides a design for storing time series data as tabular information related to spatial features (e.g. wells, gages). The Arc Hydro design relates time series values with spatial features through the HydroID-FeatureID relationship. Every time series value is indexed by a Date/time and by a location through a FeatureID that relates to a spatial feature. For example, water levels recorded in a specific well are indexed with the HydroID of the well.
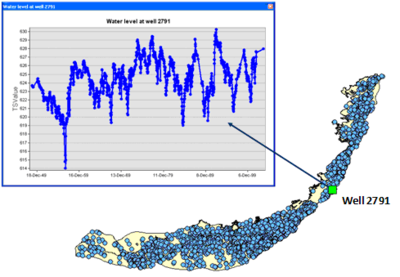
The Time Series Grapher tool automates the creation of time series plots (e.g. groundwater levels, concentrations). The tool is an interactive tool that allows users to click on features and plot related time series data. The user first sets up the tool by specifying certain options.
Once the setup is complete, the user can click on features in the map to create the plot of associated time series. See the documentation next to the ![]() icon to learn how this works in ArcGIS Pro.
icon to learn how this works in ArcGIS Pro.


