User:Jcreer/SMS:GIS Conversion and Editing: Difference between revisions
No edit summary |
|||
| (3 intermediate revisions by the same user not shown) | |||
| Line 1: | Line 1: | ||
__NOINDEX__ | |||
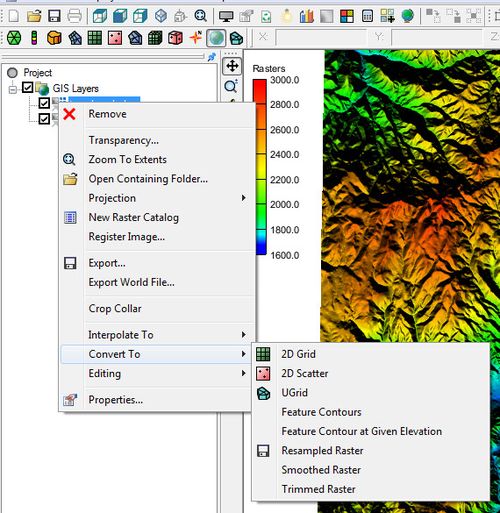
[[File:GISrightMenu.jpg|thumb|500 px|Example of a GIS item right-click menu in GMS.]] | [[File:GISrightMenu.jpg|thumb|500 px|Example of a GIS item right-click menu in GMS.]] | ||
SMS can load GIS data such as digital elevation models (DEMs) and images. This GIS data will appear in the GIS Data section of the Project Explorer. | |||
==GIS Data Conversion== | ==GIS Data Conversion== | ||
| Line 15: | Line 16: | ||
===Raster to 2D Scatter=== | ===Raster to 2D Scatter=== | ||
Selecting the command ''Convert To'' | '''2D Scatter''' will bring up the ''Raster → Scatter'' dialog. The dialog shows the number of scatter point that will be generated in the new set and allows naming the new scatter set. By default, the name of new scatter set will be the same as the raster set unless changed. | Selecting the command ''Convert To'' | '''2D Scatter''' will bring up the ''Raster → Scatter'' dialog. The dialog shows the number of scatter point that will be generated in the new set and allows naming the new scatter set. By default, the name of new scatter set will be the same as the raster set unless changed. | ||
[[File:RasterToScatter. | [[File:RasterToScatter.png|thumb|none|325 px|Example of the ''Raster → Scatter'' dialog.]] | ||
By default scatter points are shown in red unless changed in the ''Display Options'' dialog. It may necessary to zoom in to see each point. Scatter points are visible in other views while the DEM is visible only in plan view. | By default scatter points are shown in red unless changed in the ''Display Options'' dialog. It may necessary to zoom in to see each point. Scatter points are visible in other views while the DEM is visible only in plan view. | ||
| Line 35: | Line 36: | ||
===Flood Depths=== | ===Flood Depths=== | ||
This command will create a mapped depth raster. This requires an elevation raster and a water surface elevation dataset. Clicking the command from an elevation raster will bring up a ''Select Geometry and Dataset'' dialog where the geometry containing the water surface elevation dataset can be selected. Once the water surface elevation dataset has been specified, the new raster can be saved. | This command will create a mapped depth raster. This requires an elevation raster and a water surface elevation dataset. Clicking the command from an elevation raster will bring up a ''Select Geometry and Dataset'' dialog where the geometry containing the water surface elevation dataset can be selected. Once the water surface elevation dataset has been specified, the new raster can be saved. | ||
==GIS Data Editing== | ==GIS Data Editing== | ||
| Line 75: | Line 75: | ||
#The ''Save As'' dialog will appear to save a file with the trimmed data. | #The ''Save As'' dialog will appear to save a file with the trimmed data. | ||
#:[[File:TrimmedRaster3.jpg|thumb|none|450 px|Example of a trimmed raster.]] | #:[[File:TrimmedRaster3.jpg|thumb|none|450 px|Example of a trimmed raster.]] | ||
The final raster is trimmed along | The final raster is trimmed along the polygon. Trimmed rasters will also trim to multiple selected polygons. | ||
=== Merged Raster=== | === Merged Raster=== | ||
Latest revision as of 23:09, 28 February 2023
SMS can load GIS data such as digital elevation models (DEMs) and images. This GIS data will appear in the GIS Data section of the Project Explorer.
GIS Data Conversion
Both GMS and SMS offer methods to convert GIS data. Right-clicking on a GIS data item in the Project Explorer brings up a menu with a Convert To sub-menu. The commands in the Convert To sub-menu are:
Raster to 2D Scatter
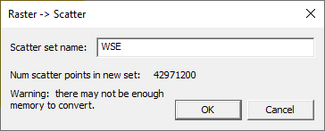
Selecting the command Convert To | 2D Scatter will bring up the Raster → Scatter dialog. The dialog shows the number of scatter point that will be generated in the new set and allows naming the new scatter set. By default, the name of new scatter set will be the same as the raster set unless changed.
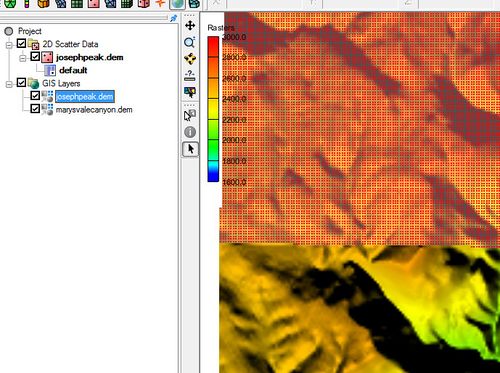
By default scatter points are shown in red unless changed in the Display Options dialog. It may necessary to zoom in to see each point. Scatter points are visible in other views while the DEM is visible only in plan view.
Feature Contours
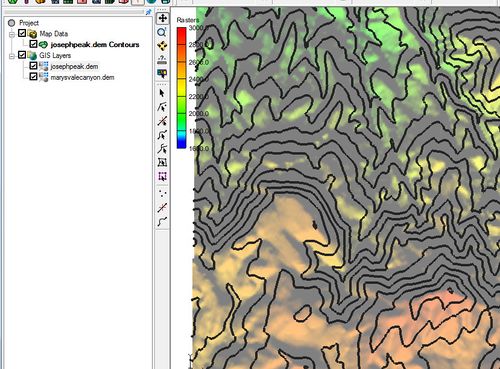
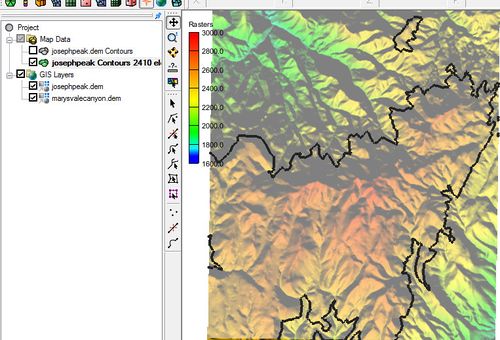
Activating this command will automatically generate contours which will appear as a new coverage under Map Data in the Project Explorer. By default, contour lines are shown in black unless the contour color is changed in the Display Options dialog. The contour interval is found by creating ten contours evenly spaced between the min and max dataset values.
Feature Contours at Given Elevation
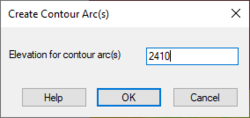
This command will bring up the Create Contour Arc dialog. In this dialog, specify an elevation to be used in generating the contours.
After entering an elevation and clicking OK, contours will be generated similar to those created with the Feature Contours command but using the specified elevation. Only contours at the specified elevation will be generated.
Flood Depths
This command will create a mapped depth raster. This requires an elevation raster and a water surface elevation dataset. Clicking the command from an elevation raster will bring up a Select Geometry and Dataset dialog where the geometry containing the water surface elevation dataset can be selected. Once the water surface elevation dataset has been specified, the new raster can be saved.
GIS Data Editing
Resampled Raster
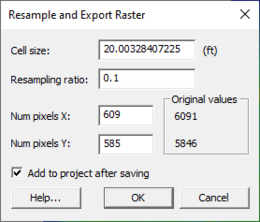
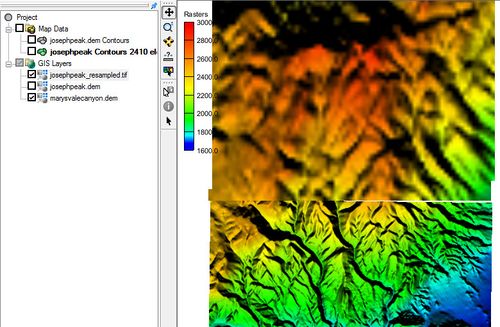
This command will bring up the Resample and Export Raster dialog. Resampling creates a new DEM covering the bounds of the selected DEM with a specified spacing. The dialog has the following options:
- Cell size – Specify the size of each cell based on the Resampling ratio.
- Resampling ratio – Specifies the resampling ratio. This is required for processing. Changing this field will change the other fields in the dialog automatically.
- Num pixels X – The number of pixels on the x axis that will be generated. The original number will be displayed to the right.
- Num pixels Y – The number of pixels on the y axis. The original number will be displayed to the right.
- Add to project after saving – Toggling this option on will load the resampled file into GMS/SMS upon completion.
After completing the Resample and Export Raster dialog, and clicking OK, the Save As dialog will appear to save a file with the resampled data.
Smoothed Raster
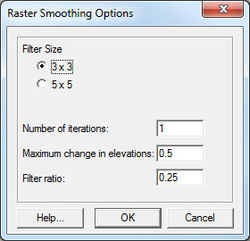
This command will bring up the Raster Smoothing Options dialog. The dialog is used to smooth the values on the DEM based on use specified weighting functions. The dialog has the following options:
- Filter Size – To smooth the raster, an N x N filter matrix is placed over each elevation point and a new elevation is computed by taking an inverse-distance weighted average of all elevations within the filter. The dimension of N can be specified as either 3x3 or 5x5, meaning that new elevations are computed from either the nearest 8 or 24 neighboring points.
- Number of iterations – Specify the number of smoothing iterations. By default only one iteration is done, but sometimes several smoothing iterations are required to propagate a change in elevations across a large flat area.
- Maximum change in elevation – Can be used to ensure that the integrity of the original elevations are maintained.
- Filter ratio – Should be between 0-1, and is used to specify the weight of the central cell of the filtering matrix.
After completing the Raster Smoothing Options dialog, and clicking OK, the Save As dialog will appear to save a file with the smoothed data.
Trimmed Raster
This command creates a new DEM from the selected DEM trimmed to the bounds of the active coverage or the selected polygons of the active coverage. Coverage polygons must be selected to define the trimming rectangle. If this is not done, then a warning dialog will appear as a reminder.
To create a trimmed raster:
- Select a coverage (or create a new coverage) in the Map module.
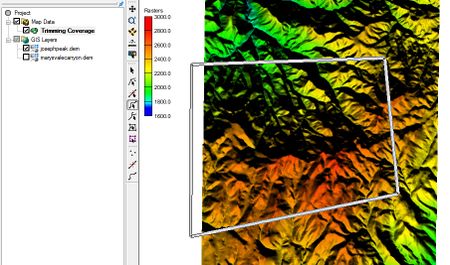
- Select the Create Feature Arc tool and draw a closed set of arcs.
- While the arcs are selected, go to Feature Objects | Build Polygons.
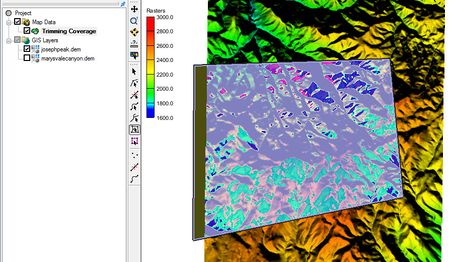
- Use the Select Polygon tool to select the polygon just created.
- Right-click a DEM in the GIS data and select Convert To | Trimmed Raster.
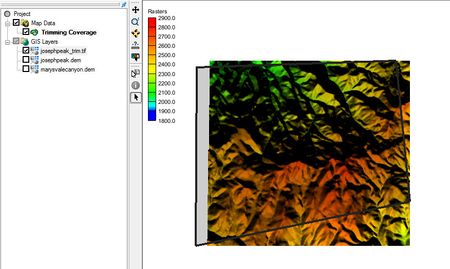
- The Save As dialog will appear to save a file with the trimmed data.
The final raster is trimmed along the polygon. Trimmed rasters will also trim to multiple selected polygons.
Merged Raster
This command appears when multiple rasters are selected. It creates a new raster that covers all selected rasters with a resolution set to the smallest cell size of any of the selected rasters. Two or more DEM datasets can be merged together by doing the following:
- Select two or more DEM items in the Project Explorer by holding down the Shift key while selecting each item.
- Right-click on one of the selected DEMs and select Convert To | Merged Raster. This command is only available when multiple raster items have been selected.
- The Save As dialog will appear to save a file with the merged data.
The new merged DEM will be visible in the Project Explorer. When merging, the smallest cell size among the merging rasters is used.
Edit Raster
A DEM may have bad cell values or based on the resolution may not represent continuous values along a line. These value can be edited to remove the bad value or ensure continuous representation of a feature such as an embankment or channel. The new values are specified using feature objects (arcs or nodes) in the Map module. To create an edited raster:
- Select (or create) one or more feature arcs/feature nodes with the desired raster values specified on the feature object. (i.e. the z-value specified for the nodes/vertices/points represent the values desired under the feature objects in the raster)
- Right-click on one of the selected DEMs and select Editing | Arc Elevation Profile.
- The Save As dialog will appear to save a file with the edited data.
The new edited DEM will be visible in the Project Explorer.
Saving Raster Data
Raster data being converted can be saved in any of the following formats:
|
|
Related Topics
| [hide] SMS – Surface-water Modeling System | ||
|---|---|---|
| Modules: | 1D Grid • Cartesian Grid • Curvilinear Grid • GIS • Map • Mesh • Particle • Quadtree • Raster • Scatter • UGrid |  |
| General Models: | 3D Structure • FVCOM • Generic • PTM | |
| Coastal Models: | ADCIRC • BOUSS-2D • CGWAVE • CMS-Flow • CMS-Wave • GenCade • STWAVE • WAM | |
| Riverine/Estuarine Models: | AdH • HEC-RAS • HYDRO AS-2D • RMA2 • RMA4 • SRH-2D • TUFLOW • TUFLOW FV | |
| Aquaveo • SMS Tutorials • SMS Workflows | ||
