User:Rcorrigan/AHGW Pro:Arc Hydro Groundwater Model: Difference between revisions
(Created page with "__NOINDEX__ thumb|300px|Overview diagram of the Arc Hydro Groundwater Data Model '''Arc Hydro Groundwater''' is a geodatabase design for rep...") |
No edit summary |
||
| (5 intermediate revisions by the same user not shown) | |||
| Line 2: | Line 2: | ||
[[Image:Archydrogw overview.jpg|thumb|300px|Overview diagram of the Arc Hydro Groundwater Data Model]] | [[Image:Archydrogw overview.jpg|thumb|300px|Overview diagram of the Arc Hydro Groundwater Data Model]] | ||
'''Arc Hydro Groundwater''' is a geodatabase design for representing groundwater datasets within ArcGIS. The data models helps archive, display, and analyze multidimensional groundwater data, and includes several components to represent different types of datasets including representations of aquifers and wells/boreholes, 3D hydrogeologic models, temporal information | '''Arc Hydro Groundwater Pro''' is a geodatabase design for representing groundwater datasets within ArcGIS Pro. The data models helps archive, display, and analyze multidimensional groundwater data, and includes several components to represent different types of datasets including representations of aquifers and wells/boreholes, 3D hydrogeologic models, temporal information. The data model is compatible with the surface water data model and will share the same framework. | ||
==Background== | ==Background== | ||
The Arc Hydro data model started as a data model for representing surface water systems within an ArcGIS geodatabase. In 2002 the Arc Hydro data model was published as an ESRI book entitled: ''Arc Hydro GIS for Water Resources''. Arc Hydro has been highly successful and has been widely adopted in industry. The groundwater data model has been developed as a companion to the surface water data model. The data model is based on a newly designed Arc Hydro framework which is shared by the surface water and groundwater data models. Users can add groundwater and surface water components to the framework as necessary, or develop their own components. This new componentized approach enables tailoring the geodatabase design to meet specific project needs. Each component of Arc Hydro Groundwater data model is described below. | The Arc Hydro data model started as a data model for representing surface water systems within an ArcGIS geodatabase. In 2002 the Arc Hydro data model was published as an ESRI book entitled: ''Arc Hydro GIS for Water Resources''. Arc Hydro has been highly successful and has been widely adopted in industry. The groundwater data model has been developed as a companion to the surface water data model. The data model is based on a newly designed Arc Hydro framework which is shared by the surface water and groundwater data models. Users can add groundwater and surface water components to the framework as necessary, or develop their own components. This new componentized approach enables tailoring the geodatabase design to meet specific project needs. Each component of Arc Hydro Groundwater data model is described below. | ||
The groundwater data model is | The groundwater data model is documented as an ESRI Press book: ''Arc Hydro Groundwater Data Model''. | ||
This wiki compliments the book but is not a replacement for it. | This wiki compliments the book but is not a replacement for it. | ||
:'''''ArcGIS Notes''''' | |||
:In ArcGIS there are raster catalogs, but not in ArcGIS Pro. In ArcGIS Pro, mosaic datasets serve a similar purpose to raster catalogs. For ArcGIS, read "raster catalog" whenever this document says "mosaic dataset". | |||
:The icons in this document are mostly from ArcGIS with the exception of the ArcGIS Pro mosaic dataset icon. The rest of the icons only have slight differences in appearance between the interfaces of the two software. | |||
==Framework Component== | ==Framework Component== | ||
| Line 90: | Line 94: | ||
| EndTime || Date || The end date/time value of the series. | | EndTime || Date || The end date/time value of the series. | ||
|- style="background:WhiteSmoke;" | |- style="background:WhiteSmoke;" | ||
| ValueCount || Long Integer || Number of time | | ValueCount || Long Integer || Number of time series values in the series. | ||
|} | |} | ||
<br> | <br> | ||
| Line 270: | Line 274: | ||
| colspan=3 style="background:#4545AA; color:White; text-align:left;" | [[Image:GIS_Point.png|20px]] [[Image:GIS_Line.png|20px]] [[Image:GIS_Polygon.png|20px]] '''GeologyPoint, GeologyLine, and GeologyArea''' | | colspan=3 style="background:#4545AA; color:White; text-align:left;" | [[Image:GIS_Point.png|20px]] [[Image:GIS_Line.png|20px]] [[Image:GIS_Polygon.png|20px]] '''GeologyPoint, GeologyLine, and GeologyArea''' | ||
|- | |- | ||
| colspan=3 | Point, line and polygon features | | colspan=3 | Point, line, and polygon features | ||
|- style="background:LightGray;" | |- style="background:LightGray;" | ||
| style="width: 100px"| '''Field name''' | | style="width: 100px"| '''Field name''' | ||
| Line 381: | Line 385: | ||
| WellID || Long Integer || References the HydroID of a Well feature. | | WellID || Long Integer || References the HydroID of a Well feature. | ||
|- style="background:WhiteSmoke;" | |- style="background:WhiteSmoke;" | ||
| | | Material || Text || Description of strata observed along a borehole. Usually documented in drilling logs and later classified into geologic/hydrogeologic units. | ||
|- style="background:WhiteSmoke;" | |- style="background:WhiteSmoke;" | ||
| HGUID || Long Integer || Hydrogeologic unit identifier. Classifies borehole data into hydrogeologic units defined in the HydrogeologicUnit table. | | HGUID || Long Integer || Hydrogeologic unit identifier. Classifies borehole data into hydrogeologic units defined in the HydrogeologicUnit table. | ||
| Line 395: | Line 399: | ||
==Hydrostratigraphy== | ==Hydrostratigraphy== | ||
The hydrostratigraphy component represents hydrogeologic units using 2D and 3D features. Classes in the component enable the representation of hydrogeologic models including 2D polygons representing the extent of hydrogeologic units, cross sections, surfaces representing the top and bottom of hydrogeologic units, volume elements. In the Arc Hydro Groundwater data model, the 2D representation of cross | The hydrostratigraphy component represents hydrogeologic units using 2D and 3D features. Classes in the component enable the representation of hydrogeologic models including 2D polygons representing the extent of hydrogeologic units, cross sections, surfaces representing the top and bottom of hydrogeologic units, volume elements. In the Arc Hydro Groundwater data model, the 2D representation of cross sections is implemented with multiple feature classes, and these are given the “XS2D” prefix (e.g., XS2D_Boreline and XS2D_Panel). | ||
[[Image:Archydrogw hydrostratigraphy.jpg|thumb|300px|Hydrostratigraphy component]] | [[Image:Archydrogw hydrostratigraphy.jpg|thumb|300px|Hydrostratigraphy component]] | ||
* '''[[#geoarea_table|GeoArea]]''' – Polygon feature class for representing the 2D extent of hydrogeologic units or parts of them. | * '''[[#geoarea_table|GeoArea]]''' – Polygon feature class for representing the 2D extent of hydrogeologic units or parts of them. | ||
* '''[[#georaster_table|GeoRasters]]''' – | * '''[[#georaster_table|GeoRasters]]''' – Mosaic dataset for storing raster surfaces. The dataset enables storing rasters within the geodatabase and adding attributes describing raster datasets. | ||
* '''[[#geosection_table|GeoSection]]''' – 3D multipatch feature class representing vertical cross sections. | * '''[[#geosection_table|GeoSection]]''' – 3D multipatch feature class representing vertical cross sections. | ||
* '''[[#geovolume_table|GeoVolume]]''' – 3D volume objects representing hydrogeologic units. | * '''[[#geovolume_table|GeoVolume]]''' – 3D volume objects representing hydrogeologic units. | ||
| Line 409: | Line 413: | ||
* '''[[#xs2dcatalog_table|XS2D_Catalog]]''' – Table for managing XS2D feature classes and their association with SectionLine features. | * '''[[#xs2dcatalog_table|XS2D_Catalog]]''' – Table for managing XS2D feature classes and their association with SectionLine features. | ||
* '''[[#xs2dboreline_table|XS2D_BoreLine]]''' – Polyline feature class for representing vertical borehole data projected on a vertical plane along a section line. Usually, when creating a new cross | * '''[[#xs2dboreline_table|XS2D_BoreLine]]''' – Polyline feature class for representing vertical borehole data projected on a vertical plane along a section line. Usually, when creating a new cross section, a set of wells is selected near the line defining the cross section, and hydrostratigraphic data along the boreholes is projected on the cross section plane. | ||
* '''[[#xs2dpanel_table|XS2D_Panel]]''' – Polygon feature class for representing hydrogeologic units as 2D cross | * '''[[#xs2dpanel_table|XS2D_Panel]]''' – Polygon feature class for representing hydrogeologic units as 2D cross section "panels." Usually a cross section will be formed by a set of XS2D_Panel features, each representing a hydrogeologic unit along a section line. | ||
* '''[[#xs2dpaneldivider_table|XS2D_PanelDivider]]''' – Polyline feature class representing vertical lines on a cross | * '''[[#xs2dpaneldivider_table|XS2D_PanelDivider]]''' – Polyline feature class representing vertical lines on a cross section plane, showing the location where a section line changes direction (i.e., the location of vertices of the section line). Panel dividers are used as guides for orientation when viewing the 2D cross section. | ||
* '''[[#xs2dmajorgrid_table|XS2D_MajorGrid and XS2D_MinorGrid]]''' – Polyline feature classes representing grid lines showing the vertical and horizontal dimensions in a 2D cross | * '''[[#xs2dmajorgrid_table|XS2D_MajorGrid and XS2D_MinorGrid]]''' – Polyline feature classes representing grid lines showing the vertical and horizontal dimensions in a 2D cross section. Major grid lines are typically drawn as vertical and horizontal lines across the cross section, while minor grid lines are indicated by tick marks along the border of the cross section. | ||
| Line 441: | Line 445: | ||
{| class="mw-collapsible" style="width: 90%; font-size: 85%; border-spacing: 0px; border: 1px solid darkgray;" | {| class="mw-collapsible" style="width: 90%; font-size: 85%; border-spacing: 0px; border: 1px solid darkgray;" | ||
|- id="georaster_table" | |- id="georaster_table" | ||
| colspan=3 style="background:#4545AA; color:White; text-align:left;" | [[ | | colspan=3 style="background:#4545AA; color:White; text-align:left;" | [[File:ArcGIS Pro mosaic dataset.png|20 px]] '''GeoRasters''' | ||
|- | |- | ||
| colspan=3 | | | colspan=3 | Mosaic Dataset | ||
|- style="background:LightGray;" | |- style="background:LightGray;" | ||
| style="width: 100px"| '''Field name''' | | style="width: 100px"| '''Field name''' | ||
| Line 449: | Line 453: | ||
| '''Description''' | | '''Description''' | ||
|- style="background:WhiteSmoke;" | |- style="background:WhiteSmoke;" | ||
| Name || Text || Generic | | Name || Text || Generic attribute of mosaic datasets that store rasters (created automatically when you create a mosaic dataset for rasters) used to store the name of a raster dataset. | ||
|- style="background:WhiteSmoke;" | |- style="background:WhiteSmoke;" | ||
| Description || Text || Text descriptor of the raster (e.g., formation top, formation bottom). | | Description || Text || Text descriptor of the raster (e.g., formation top, formation bottom). | ||
| Line 455: | Line 459: | ||
| RasUnits || Text || The raster units (e.g., feet above mean sea level). | | RasUnits || Text || The raster units (e.g., feet above mean sea level). | ||
|- style="background:WhiteSmoke;" | |- style="background:WhiteSmoke;" | ||
| HGUID || Long Integer || Hydrogeologic unit identifier. Relates rasters in the | | HGUID || Long Integer || Hydrogeologic unit identifier. Relates rasters in the dataset with more detailed descriptions of hydrogeologic units defined in the HydrogeologicUnit table. | ||
|- style="background:WhiteSmoke;" | |- style="background:WhiteSmoke;" | ||
| HGUCode || Text || Text descriptor of the hydrogeologic unit used for labeling, symbolization, and queries. | | HGUCode || Text || Text descriptor of the hydrogeologic unit used for labeling, symbolization, and queries. | ||
| Line 563: | Line 567: | ||
| HydroCode || Text || Permanent public identifier of the feature used for relating features with external information systems. | | HydroCode || Text || Permanent public identifier of the feature used for relating features with external information systems. | ||
|- style="background:WhiteSmoke;" | |- style="background:WhiteSmoke;" | ||
| SName || Text || Section name. Text descriptor of the | | SName || Text || Section name. Text descriptor of the SectionLine for labeling, symbolization, and queries (e.g., A-A’). | ||
|- style="background:WhiteSmoke;" | |- style="background:WhiteSmoke;" | ||
| VertExag2D || Double || Vertical exaggeration that will be applied when creating XS2D features (see section on representing vertical cross sections in 2D). | | VertExag2D || Double || Vertical exaggeration that will be applied when creating XS2D features (see section on representing vertical cross sections in 2D). | ||
| Line 617: | Line 621: | ||
| HGUCode || Text || Text descriptor of the hydrogeologic unit used for labeling, symbolization, and queries. | | HGUCode || Text || Text descriptor of the hydrogeologic unit used for labeling, symbolization, and queries. | ||
|- style="background:WhiteSmoke;" | |- style="background:WhiteSmoke;" | ||
| Offset || Double || Distance from the well related to the XS2D_BoreLine feature to the nearest point on the | | Offset || Double || Distance from the well related to the XS2D_BoreLine feature to the nearest point on the SectionLine (distance units are the same as the units of the SectionLine feature class). | ||
|- style="background:WhiteSmoke;" | |- style="background:WhiteSmoke;" | ||
| Measure || Double || Distance along the | | Measure || Double || Distance along the SectionLine to the Well feature associated with the XS2D_BoreLine feature. The distance is measured from the starting point of the SectionLine to the point on the SectionLine closest to the Well feature. | ||
|- style="background:WhiteSmoke;" | |- style="background:WhiteSmoke;" | ||
| IsLeft || Long Integer || TRUE if the Well feature associated with the XS2D_BoreLine is on the left side of a | | IsLeft || Long Integer || TRUE if the Well feature associated with the XS2D_BoreLine is on the left side of a SectionLine in the direction of digitization. FALSE if it is on the right side. | ||
|- style="background:WhiteSmoke;" | |- style="background:WhiteSmoke;" | ||
| FType || Text || Distinguishes between types of XS2D_BoreLine features. | | FType || Text || Distinguishes between types of XS2D_BoreLine features. | ||
| Line 649: | Line 653: | ||
{| class="mw-collapsible" style="width: 90%; font-size: 85%; border-spacing: 0px; border: 1px solid darkgray;" | {| class="mw-collapsible" style="width: 90%; font-size: 85%; border-spacing: 0px; border: 1px solid darkgray;" | ||
|- id="xs2dpaneldivider_table" | |- id="xs2dpaneldivider_table" | ||
| colspan=3 style="background:#4545AA; color:White; text-align:left;" | [[Image:GIS_Line.png|20px]] ''' | | colspan=3 style="background:#4545AA; color:White; text-align:left;" | [[Image:GIS_Line.png|20px]] '''XS2D_PanelDivider''' | ||
|- | |- | ||
| colspan=3 | Polyline Feature Class | | colspan=3 | Polyline Feature Class | ||
| Line 678: | Line 682: | ||
| HydroCode || Text || Permanent public identifier of the feature used for relating features with external information systems. | | HydroCode || Text || Permanent public identifier of the feature used for relating features with external information systems. | ||
|- style="background:WhiteSmoke;" | |- style="background:WhiteSmoke;" | ||
| GridValue || Double || Elevation or measure (distance along | | GridValue || Double || Elevation or measure (distance along SectionLine) value used for labeling grid lines, using the same distance units as the coordinate system of the SectionLine feature associated with the cross section. | ||
|- style="background:WhiteSmoke;" | |- style="background:WhiteSmoke;" | ||
| IsVertical || Long Integer || TRUE if the grid line is vertical; FALSE if it is horizontal. | | IsVertical || Long Integer || TRUE if the grid line is vertical; FALSE if it is horizontal. | ||
| Line 686: | Line 690: | ||
The Time Series component provides a new design for dealing with temporal data within Arc Hydro. The new design provides better support for utilizing multiple representations of time series data and a new table to describe time series variables. | The Time Series component provides a new design for dealing with temporal data within Arc Hydro. The new design provides better support for utilizing multiple representations of time series data and a new table to describe time series variables. | ||
[[Image:Temporal.jpg|thumb|300px|The Arc Hydro Groundwater Temporal | [[Image:Temporal.jpg|thumb|300px|The Arc Hydro Groundwater Temporal component]] | ||
* '''[[#attributeseries_table|AttributeSeries]]''' – Table for archiving time | * '''[[#attributeseries_table|AttributeSeries]]''' – Table for archiving time series data where multiple variables are indexed with the same feature and time. | ||
* '''[[#datasetcatalog_table|DatasetCatalog]]''' – Table for indexing time | * '''[[#datasetcatalog_table|DatasetCatalog]]''' – Table for indexing time series datasets. | ||
* '''[[#featureseries_table|FeatureSeries]]''' – Collections of features indexed by time representing a series of geometries varying in location or shape. | * '''[[#featureseries_table|FeatureSeries]]''' – Collections of features indexed by time representing a series of geometries varying in location or shape. | ||
* '''[[#rasterseries_table|RasterSeries]]''' – | * '''[[#rasterseries_table|RasterSeries]]''' – Mosaic dataset for storing collections of raster datasets indexed by time. | ||
* '''[[#seriescatalog_table|SeriesCatalog]]''' – Table for indexing and summarizing time series stored in the TimeSeries table. | * '''[[#seriescatalog_table|SeriesCatalog]]''' – Table for indexing and summarizing time series stored in the TimeSeries table. | ||
* '''[[#timeseriestimeseries_table|TimeSeries]]''' – Table for storing single-variable time series. | * '''[[#timeseriestimeseries_table|TimeSeries]]''' – Table for storing single-variable time series. | ||
| Line 734: | Line 738: | ||
| VarID || Long Integer || Numerical identifier for the variable within the geodatabase. Matches the HydroID of the associated record in the VariableDefinition table. | | VarID || Long Integer || Numerical identifier for the variable within the geodatabase. Matches the HydroID of the associated record in the VariableDefinition table. | ||
|- style="background:WhiteSmoke;" | |- style="background:WhiteSmoke;" | ||
| DsType || Text || Type of time | | DsType || Text || Type of time series dataset described, e.g., RasterSeries, FeatureSeries, Feature Layer. | ||
|- style="background:WhiteSmoke;" | |- style="background:WhiteSmoke;" | ||
| DsSource || Text || Name of the time | | DsSource || Text || Name of the time series dataset described. | ||
|- style="background:WhiteSmoke;" | |- style="background:WhiteSmoke;" | ||
| TsTable || Text || Name of the time | | TsTable || Text || Name of the time series table that contains time series values, used in cases where features are associated with a time series of values stored in a separate table (e.g., wells related with water levels, or polygons related with precipitation) | ||
|- style="background:WhiteSmoke;" | |- style="background:WhiteSmoke;" | ||
| StartTime || Date || Start date/time of the series. | | StartTime || Date || Start date/time of the series. | ||
| Line 744: | Line 748: | ||
| EndTime || Date || End date/time of the series. | | EndTime || Date || End date/time of the series. | ||
|- style="background:WhiteSmoke;" | |- style="background:WhiteSmoke;" | ||
| StepCount || Long Integer || Number of unique time steps in the time | | StepCount || Long Integer || Number of unique time steps in the time series dataset. | ||
|} | |} | ||
<br> | <br> | ||
| Line 770: | Line 774: | ||
{| class="mw-collapsible" style="width: 90%; font-size: 85%; border-spacing: 0px; border: 1px solid darkgray;" | {| class="mw-collapsible" style="width: 90%; font-size: 85%; border-spacing: 0px; border: 1px solid darkgray;" | ||
|- id="rasterseries_table" | |- id="rasterseries_table" | ||
| colspan=3 style="background:#4545AA; color:White; text-align:left;" | [[ | | colspan=3 style="background:#4545AA; color:White; text-align:left;" | [[File:ArcGIS Pro mosaic dataset.png|20 px]] '''RasterSeries ''' | ||
|- | |- | ||
| colspan=3 | | | colspan=3 | Mosaic Dataset | ||
|- style="background:LightGray;" | |- style="background:LightGray;" | ||
| style="width: 100px"| '''Field name''' | | style="width: 100px"| '''Field name''' | ||
| Line 778: | Line 782: | ||
| '''Description''' | | '''Description''' | ||
|- style="background:WhiteSmoke;" | |- style="background:WhiteSmoke;" | ||
| Name || Text || Generic attribute (created automatically when you create a | | Name || Text || Generic attribute (created automatically when you create a mosaic dataset) used to store the name of a raster dataset. | ||
|- style="background:WhiteSmoke;" | |- style="background:WhiteSmoke;" | ||
| VarID || Long Integer || Numerical identifier for the variable within the geodatabase. Matches the HydroID of the associated record in the VariableDefinition table. | | VarID || Long Integer || Numerical identifier for the variable within the geodatabase. Matches the HydroID of the associated record in the VariableDefinition table. | ||
| Line 809: | Line 813: | ||
| EndTime || Date || The end date/time value of the series. | | EndTime || Date || The end date/time value of the series. | ||
|- style="background:WhiteSmoke;" | |- style="background:WhiteSmoke;" | ||
| ValueCount || Long Integer || Number of time | | ValueCount || Long Integer || Number of time series values in the series. | ||
|} | |} | ||
<br> | <br> | ||
| Line 855: | Line 859: | ||
| VarCode || Text || Public identifier for a variable (e.g., "00060" for discharge in USGS NWIS). | | VarCode || Text || Public identifier for a variable (e.g., "00060" for discharge in USGS NWIS). | ||
|- style="background:WhiteSmoke;" | |- style="background:WhiteSmoke;" | ||
| Medium || Text || Medium in which the variable is observed or occurs (e.g., " | | Medium || Text || Medium in which the variable is observed or occurs (e.g., "Groundwater") | ||
|- style="background:WhiteSmoke;" | |- style="background:WhiteSmoke;" | ||
| VarUnits || Text || Units of measure for the variable. | | VarUnits || Text || Units of measure for the variable. | ||
| Line 873: | Line 877: | ||
The AHGW simulation feature dataset is a set of vector feature classes that can represent common modeling objects and it is designed to allow for representation of finite element and finite difference systems in a GIS. The simulation feature dataset includes four feature classes: Boundary, Cell2D, Cell3D, Node2D, and Node3D. These feature classes enable storage and representation of model inputs and outputs related to the simulation objects. | The AHGW simulation feature dataset is a set of vector feature classes that can represent common modeling objects and it is designed to allow for representation of finite element and finite difference systems in a GIS. The simulation feature dataset includes four feature classes: Boundary, Cell2D, Cell3D, Node2D, and Node3D. These feature classes enable storage and representation of model inputs and outputs related to the simulation objects. | ||
[[Image:Simulation_Features.png|thumb|300px|The Arc Hydro Groundwater Simulation Feature Dataset | [[Image:Simulation_Features.png|thumb|300px|The Arc Hydro Groundwater Simulation Feature Dataset]] | ||
* '''[[#boundary_table|Boundary]]''' – Polygon feature class that represents the two-dimensional extent of a model. It is not an essential part of the model representation but it can be useful to illustrate the location of the simulation model to support a simple spatial reference or database query. | * '''[[#boundary_table|Boundary]]''' – Polygon feature class that represents the two-dimensional extent of a model. It is not an essential part of the model representation but it can be useful to illustrate the location of the simulation model to support a simple spatial reference or database query. | ||
Latest revision as of 16:50, 1 September 2022
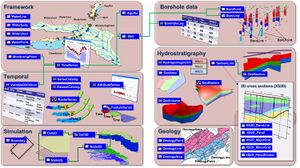
Arc Hydro Groundwater Pro is a geodatabase design for representing groundwater datasets within ArcGIS Pro. The data models helps archive, display, and analyze multidimensional groundwater data, and includes several components to represent different types of datasets including representations of aquifers and wells/boreholes, 3D hydrogeologic models, temporal information. The data model is compatible with the surface water data model and will share the same framework.
Background
The Arc Hydro data model started as a data model for representing surface water systems within an ArcGIS geodatabase. In 2002 the Arc Hydro data model was published as an ESRI book entitled: Arc Hydro GIS for Water Resources. Arc Hydro has been highly successful and has been widely adopted in industry. The groundwater data model has been developed as a companion to the surface water data model. The data model is based on a newly designed Arc Hydro framework which is shared by the surface water and groundwater data models. Users can add groundwater and surface water components to the framework as necessary, or develop their own components. This new componentized approach enables tailoring the geodatabase design to meet specific project needs. Each component of Arc Hydro Groundwater data model is described below.
The groundwater data model is documented as an ESRI Press book: Arc Hydro Groundwater Data Model. This wiki compliments the book but is not a replacement for it.
- ArcGIS Notes
- In ArcGIS there are raster catalogs, but not in ArcGIS Pro. In ArcGIS Pro, mosaic datasets serve a similar purpose to raster catalogs. For ArcGIS, read "raster catalog" whenever this document says "mosaic dataset".
- The icons in this document are mostly from ArcGIS with the exception of the ArcGIS Pro mosaic dataset icon. The rest of the icons only have slight differences in appearance between the interfaces of the two software.
Framework Component
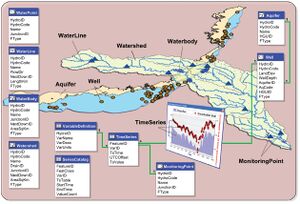
The Arc Hydro framework provides a simple data structure for storing basic spatial datasets describing hydrologic systems. The framework supports basic water resources analysis such as tracing water as it flows over the terrain in watersheds, streams, and water bodies, creating groundwater level and groundwater quality maps, and viewing time series data related with monitoring stations and wells.
- Aquifer – Polygon features representing aquifer boundaries. The features can be classified to represent different zones such as outcrop and confined sections of the aquifer.
- MonitoringPoint – Point features representing locations where hydrologic variables are measured, such as stream-gage stations and precipitation gages.
- SeriesCatalog – Table for indexing and summarizing time series stored in the TimeSeries table.
- TimeSeries – Table for storing time varying data such as water levels, flow, and water quality.
- VariableDefinition – Table for storing time series values.
- WaterBody – Polygon features representing areas such as ponds, lakes, swamps, and estuaries.
- WaterLine – Line features representing hydrographic “blue lines”, which represent mapped streams and water body center lines.
- WaterPoint – Point features representing hydrographic features such as springs, water withdrawal/discharge locations, and structures.
- Watershed – Polygon features representing drainage areas contributing water flow from the land surface to the water system.
- Well – Point features representing well locations and their attributes.
Geology Component
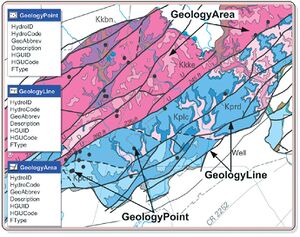
The Geology component conations a set of feature classes for representing data from geologic maps and to integrate geologic data with other groundwater-related datasets.
- GeologyPoint – Points that represent locations such as springs, caves, sinks, and observation points.
- GeologyLine – Line features that describe objects such as faults, contacts, and dikes.
- GeologyArea – Polygon features describing areal features such as rock units and alteration zones.
Borehole data
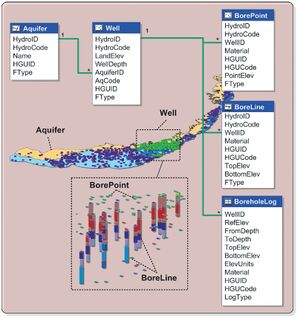
The Borehole component contains classes for representing 3D information recorded along boreholes. The data can be stored as tabular information related to well features or as 3D point and line features that can be visualized in ArcScene.
- BoreholeLog – Table for representing vertical data along boreholes. Each row in the BoreholeLog table represents a point or interval along the borehole.
- BorePoint – 3D point feature class for representing point data along boreholes
- BoreLine – 3D line feature class for representing interval data along boreholes.
Hydrostratigraphy
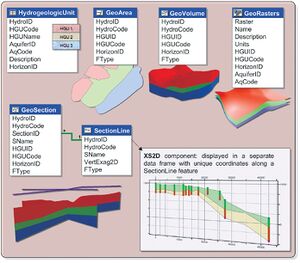
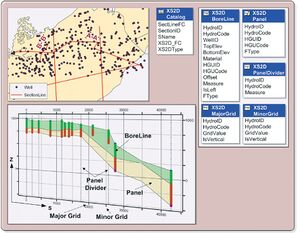
The hydrostratigraphy component represents hydrogeologic units using 2D and 3D features. Classes in the component enable the representation of hydrogeologic models including 2D polygons representing the extent of hydrogeologic units, cross sections, surfaces representing the top and bottom of hydrogeologic units, volume elements. In the Arc Hydro Groundwater data model, the 2D representation of cross sections is implemented with multiple feature classes, and these are given the “XS2D” prefix (e.g., XS2D_Boreline and XS2D_Panel).
- GeoArea – Polygon feature class for representing the 2D extent of hydrogeologic units or parts of them.
- GeoRasters – Mosaic dataset for storing raster surfaces. The dataset enables storing rasters within the geodatabase and adding attributes describing raster datasets.
- GeoSection – 3D multipatch feature class representing vertical cross sections.
- GeoVolume – 3D volume objects representing hydrogeologic units.
- HydrogeologicUnit – Table for defining conceptual hydrogeologic units.
- SectionLine – Line feature class for representing 2D section lines.
- XS2D_Catalog – Table for managing XS2D feature classes and their association with SectionLine features.
- XS2D_BoreLine – Polyline feature class for representing vertical borehole data projected on a vertical plane along a section line. Usually, when creating a new cross section, a set of wells is selected near the line defining the cross section, and hydrostratigraphic data along the boreholes is projected on the cross section plane.
- XS2D_Panel – Polygon feature class for representing hydrogeologic units as 2D cross section "panels." Usually a cross section will be formed by a set of XS2D_Panel features, each representing a hydrogeologic unit along a section line.
- XS2D_PanelDivider – Polyline feature class representing vertical lines on a cross section plane, showing the location where a section line changes direction (i.e., the location of vertices of the section line). Panel dividers are used as guides for orientation when viewing the 2D cross section.
- XS2D_MajorGrid and XS2D_MinorGrid – Polyline feature classes representing grid lines showing the vertical and horizontal dimensions in a 2D cross section. Major grid lines are typically drawn as vertical and horizontal lines across the cross section, while minor grid lines are indicated by tick marks along the border of the cross section.
Time Series
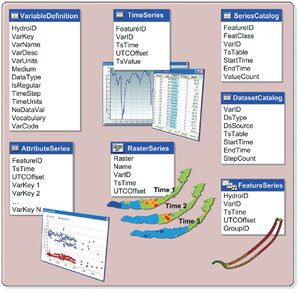
The Time Series component provides a new design for dealing with temporal data within Arc Hydro. The new design provides better support for utilizing multiple representations of time series data and a new table to describe time series variables.
- AttributeSeries – Table for archiving time series data where multiple variables are indexed with the same feature and time.
- DatasetCatalog – Table for indexing time series datasets.
- FeatureSeries – Collections of features indexed by time representing a series of geometries varying in location or shape.
- RasterSeries – Mosaic dataset for storing collections of raster datasets indexed by time.
- SeriesCatalog – Table for indexing and summarizing time series stored in the TimeSeries table.
- TimeSeries – Table for storing single-variable time series.
- VariableDefinition – Table for defining temporal variables.
Simulation
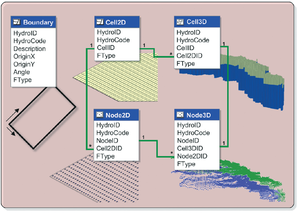
The AHGW simulation feature dataset is a set of vector feature classes that can represent common modeling objects and it is designed to allow for representation of finite element and finite difference systems in a GIS. The simulation feature dataset includes four feature classes: Boundary, Cell2D, Cell3D, Node2D, and Node3D. These feature classes enable storage and representation of model inputs and outputs related to the simulation objects.
- Boundary – Polygon feature class that represents the two-dimensional extent of a model. It is not an essential part of the model representation but it can be useful to illustrate the location of the simulation model to support a simple spatial reference or database query.
- Cell2D – Polygon feature class used to represent cells or elements associated with two-dimensional simulation models or a single layer of a three-dimensional model.
- Cell3D – Multipatch feature class for representing three-dimensional cells and elements of simulation models.
- Node2D – 2D Point feature class that represents nodes in a 2D model grid/mesh or the nodes in a single layer of a 3D model grid/mesh.
- Node3D – 3D Point feature class that represents nodes in a model grid/mesh.
See also
