GMS:2D Grid Module: Difference between revisions

From XMS Wiki
Jump to navigationJump to search
No edit summary
No edit summary
Line 6: Line 6:
{|
{|
|-
|-
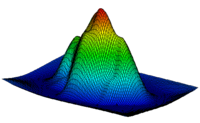
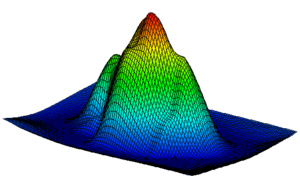
|[[Image:grid_interp.png|thumb|none|500 px|Concentration data interpolated to a 2D grid]]
|[[Image:grid_interp.png|thumb|none|300 px|Concentration data interpolated to a 2D grid]]
|-
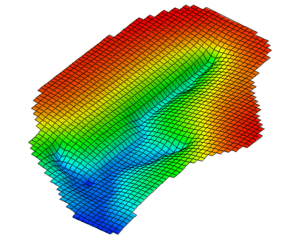
|[[Image:Sample_water_table.png|thumb|none|300 px|Watertable elevations from a MODFLOW simulation]]
|[[Image:Sample_water_table.png|thumb|none|500 px|Watertable elevations from a MODFLOW simulation]]
|}
|}


Revision as of 16:27, 1 June 2016

2D Grid Module
Grid interp.png
2D Grid
Creating and Editing 2D Grids
Converting 2D Grids
More
2D Grid Display Options
2D Grid Tool Palette
Cell Properties
2D Grid Commands

The 2D Grid module is used for creating and editing two-dimensional Cartesian grids. A number of tools are provided for working with 2D grids. Currently, GMS only allows one 2D grid per project.

2D grids are primarily used for surface visualization and contouring. This is accomplished by interpolating to the grid. The figure below is an example of interpolating contaminant concentration data to a 2D grid.

Concentration data interpolated to a 2D grid
Watertable elevations from a MODFLOW simulation

See also