User:Jcreer/SMS 13.2 Changes: Difference between revisions
| Line 194: | Line 194: | ||
*''UGrid boundary'' – Turn on to display grid boundary line on the cross section. Clicking the button next to this option will open the ''Line Properties'' dialog. | *''UGrid boundary'' – Turn on to display grid boundary line on the cross section. Clicking the button next to this option will open the ''Line Properties'' dialog. | ||
**''Feature angle'' – Enter the feature angle value for the cross section. | **''Feature angle'' – Enter the feature angle value for the cross section. | ||
*Face contours | *''Face contours'' – Turn on to see contours on the faces of the cross section. Clicking the button next to this option will open the ''Contour Options'' dialog. | ||
*Point contours | *''Point contours'' – Turn on to see contours on the points of the cross section. Clicking the button next to this option will open the ''Contour Options'' dialog. | ||
{{-}} | {{-}} | ||
Revision as of 23:49, 12 January 2022
Changes for SMS 13.2
General
- Display Themes
- Toolbox
- New Contour Label Options
- New Fill Behind option added to Contour Legend Options
3D Bridge
New content for the SMS:3D Bridge article
The 3D bridge component can be used to for multiple purposes in an SMS project. These include:
- The bridge component can be used to generate a 3D UGrid to visualize a bridge in the graphics window. Use the Add 3D Bridge UGrid to SMS on OK toggle in the Bridge dialog described below to generate this UGrid.
- The bridge component can be included in an observation plot. (See Observation Profile Plot for more information.)
- One or more bridge components can be used to generate a "ceiling elevation" dataset. This dataset represents the maximum water surface that can be reached at each point in the mesh. Nodes that have no ceiling elevation have an "inactive" value in this dataset. An upcoming version of SRH-2D will be able to utilize this dataset instead as an option to represent pressure zones. Each bridge also has a user specified Manning's N value for the underside of the bridge. Note: The ceiling elevation method of simulating pressure flow in SRH-2D is not compatible with pressure zone arcs in the simulation boundary conditions coverage. Only one of these approaches can be applied to a simulation.
Steps to Defining a 3D Bridge
To create a 3D bridge component, follow these steps:
- create a "3D bridge" coverage
- create two arcs representing the upstream and downstream faces of the bridge.
- invoke the "Edit Bridge..." command by right clicking on the coverage.
- define profiles for the top and bottom of the bridge. (There is an option to define different profiles for the upstream and downstream faces of for the bottom or low steel profile.)
Note: CAD files of the bridge design or as built configuration can be used to simplify the bridge definition. Having a topographic surface to display (2D mesh, UGrid, scatter set, grid or raster) in conjunction with the bridge is also typically very helpful.
3D Bridge Coverage
The 3D Bridge coverage is used like any other map coverage. Generally, it should have the arcs that define the upstream and downstream side of each bridge. In the Project Explorer, right-clicking on the 3D bridge coverage brings up the standard coverage right-click menu with the addition of the following command:
- Edit Bridge... – Brings up the Bridge dialog for defining the bridge profiles.
Bridge Dialog
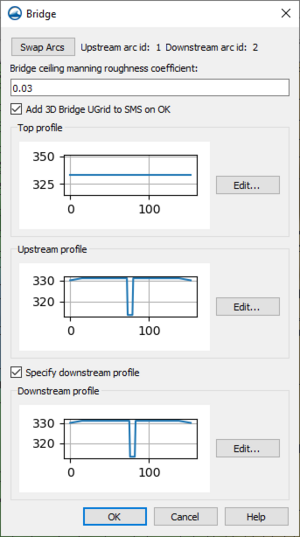
The Bridge dialog is reached by right-clicking on a bridge component and selecting the Edit Bridge... command. The dialog contains the following options:
- Swap Arcs – Changes which arc is the upstream arc and which is the downstream arc.
- Bridge ceiling manning roughness coefficient – Define a Manning's N or roughness value for the bridge if used in a model run. In particular, this option is for use of a 3D bridge that is included in an SRh-2D pressure ceiling model.
- Add 3D Bridge UGrid to SMS on OK – Exports the 3D UGrid file containing the 3D bridge then imports the bridge UGrid into the SMS project.
- Export 3D Bridge – Brings up a Save dialog where the bridge can be saved as a ugrid.
- Top profile – Defines the highest points of the bridge.
- Edit... – Launches the XY Series Editor for the bridge profiles.
- Upstream Profile – Defines the elevations on the underside of the bridge on the upstream end side.
- Edit... – Launches the XY Series Editor for the bridge profiles.
- Specify downstream profile – The downstream profile will be the same as the upstream profile unless this option is turned on.
- Downstream profile – Defines the elevations on the underside of the bridge on the downstream end side.
- Edit... – Launches the XY Series Editor for the bridge profiles.
- Downstream profile – Defines the elevations on the underside of the bridge on the downstream end side.
3D Bridge Modeling Tips
- The first arc drawn on the Area Properties coverage will be made the upstream arc by default. Use the Swap Arcs button in the Bridge dialog to change this.
- The bridge will use the same units as set in the project's projection.
- Multiple bridges can be modeled by creating addition coverages (only 1 bridge per coverage).
- When exporting the bridge, the XMUGRID file is created as well as a PRJ file containing the bridge's projection. These files should be kept together.
- When modeling piers, the stations cannot be at the same x location. This means the stations must be offset slightly for the vertical wall of the pier.
- Piers modeled using a 3D bridge should not be used to model piers in an SRH-2D pressure flow model. Piers for pressure flow in an SRH-2D should be modeled by creating a void in the mesh at the pier location.
New content for the SMS:3D Bridge workflow:
we no longer need to export the bridge from the dialog and import it into SMS separately (steps 4 and 5). Just set toggle to create it in the dialog. It is loaded automatically
Bridge Scour
- Added ability to analyze multiple scenarios at a time.
- Added Shear Dataset to the Edit Bridge Scour Scenario dialog.
- Added option to select multiple piers at the same time and assign parameters
- Added ability to link to 3D bridge to provide the bridge profile
Map Module
- New arc options to add to the SMS:Arcs article and SMS:Map Module Tools : User:Jcreer/New Arc Functions in SMS 13.2
- New option in the Export Coverage dialog. Option to select "SMS model coverage (*.dmc)" file type. User:Jcreer/SMS Model Coverage File
- Floodway delineation accessed by right click on 1D Centerline coverage now supports two methods so SMS:Floodway_Delineation should be rewritten to include unit Q option. Should also link to SRH-2D tools for floodway simulation, evaluation lines, and compare simulation.
- Archive SMS:Bridge-Piers Coverage as this coverage is being replaced by the Bridge Footprint tool in the Toolbox.
CMS-Wave
New interface
Cross Sections
New features in "import tabular data as feature objects". See SMS:File_Import_Wizard#Mapping_Options
- Option to create a new coverage for the feature objects during the import.
- Option to connect all the points in the survey in the order of the data in the file into a single arc.
New features in "Extract cross sections" command. See SMS:1D_Hyd_Cross_Section_Coverage#Extracting_Cross_Sections
- Option to use the arc nodes and vertices as elevations.
- This means you don't have to create a scatter set and be concerned about triangulation of that set.
- After extracting cross sections using a scatter set, vertices are added to the cross section to match what is in the database. The z values are copied to all points. (There isn't a new command for this, it is just part of extracting cross sections.)
New options for centerline arc types. See SMS:1D_Hyd_Centerline_Coverage
- Arcs in the centerline coverage could previously be centerline, bank, or generic. Now they can be assigned to point property.
- The arc type is set in the Arc Properties dialog. The combo box shows a list of all point properties that are found in the cross section databases that are associated with that centerline coverage.
- New properties may also be added by using the "Edit arc types..." button. When extracting cross sections, if the option to generate point properties using a centerline coverage is chosen, point properties will be created at the locations where these arcs intersect the cross sections.
Option to create arcs in centerline coverage that match point properties when generating a centerline coverage. See SMS:1D_Hyd_Cross_Section_Coverage#Coverage_Specific_Right-Click_Commands
- When using the feature to generate a centerline coverage from a cross section coverage (accessed by right-clicking the cross section coverage and selecting "Generate centerline coverage", the point properties can be used to create arcs in the centerline coverage.
- If adjacent cross sections both have the specified point property, an arc will be created in the centerline coverage connecting the two points. This arc will then be assigned to be the same type as the point property type.
- This command requires a cross section database and that the cross sections be in sequential order.
"Remove Long Arc Segments" function Can't find this option
- Right-click on the cross section coverage to access this command
- Splits the arcs in the cross section coverage by deleting segments that are significantly longer than adjacent segments
- SMS calculates the distance between vertices. If the length of a segment is at least 10 times greater than the adjacent segment, the vertex is converted to a node. After calculating the distances and converting to nodes, the arcs that do not have any vertices are deleted (these correspond to long segments between cross sections).
- This should be done before extracting cross sections.
- A centerline coverage is not necessary.
"Reverse Right → Left Cross Sections" See SMS:1D_Hyd_Cross_Section_Coverage#Coverage_Specific_Right-Click_Commands
- Right-click on the cross section coverage to access this command
- Checks the order of all cross section arcs that intersect the associated centerline. If the XS arc intersects the centerline arc in a right to left direction (looking down stream), the arc direction is reversed.
- This command only changes the feature data and the cross section database (if one exists) will not be updated to match.
"Remove invalid cross section segments" See SMS:1D_Hyd_Cross_Section_Coverage#Coverage_Specific_Right-Click_Commands
- Right-click on the cross section coverage to access this command
- Cross sections that do not cross the centerline are deleted
- Cross sections that are not "functional" with respect to the centerline are trimmed to include only the portion of the cross section that intersects the centerline and is functional. In this case, functional implies that the cross section is getting monotonically farther away from the centerline as you trace the cross section in either direction from the centerline. The functionality of the cross section is determined by the closest point on the centerline to each individual point on the cross section.
- This command requires that a centerline coverage be assigned to the cross section coverage.
- The cross section database (if one exists) will not be updated to match.
"Reproject cross sections" See SMS:1D_Hyd_Cross_Section_Coverage#Coverage_Specific_Right-Click_Commands
- Right-click on the cross section coverage to access this command
- This automatically runs the reverse direction command and the command to remove invalid cross section segments.
- Each cross section arcs is projected to a line that intersects the centerline arc perpendicular to that arc at the same location the cross section arc intersects the centerline arc. Each point on the cross section arc is projected to the perpendicular intersector in the direction of the centerline closest to that point. (Note: this is not always the intersection point/direction).
- If a cross section database exists, it will be out of date after executing this command
- A centerline coverage must be assigned to the cross section coverage for this feature.
GIS Display Options
New options for GIS display for SHP files. User:Jcreer/SMS:GIS Module Display Options 13.2
SRH-2D
- SRH-2D Simulation
- Tool menu on right-click
- SRH-2D Advanced Simulation Parameters dialogs with PEST. (SMS 99.99/13.2)
- SRH-2D Simulation Plots
- Statistical Analaysis
- SRH-2D Summary Report dialog and output. (SMS 99.99/13.2)
- Datasets to Rasters
- Create floodway simulation
- Create hydraulic evaluation lines - SMS:Floodway_Tools#Compare_Simulation_Data needs to be updated
- Compare simulation data
- SRH-2D Model
- Control Output tab includes Output Max Datasets.
- SRH-2D HY-8 Culverts:
- includes" Checked uses 2d terrain for overtopping. Unchecked disables 2d domain in culvert region and uses hy8 for overtopping.
- no longer required to specify the path to the HY-8 file before hand.
- Sediment Transport changes:
- Shear partitioning option – Separates grain roughness used to compute sediment transport capacity from the total hydraulic roughness.
- "Percentage" – Defines the shear partitioning based on a percentage.
- "Scaled D90" – Defines the shear partitioning based on a D90 scale.
- Shear partitioning percentage – Sets a percentage value to start the shear partitioning.
- Shear partitioning scaled D90 factor – Sets the partition scale from 1 to 3 times the D90 for gravels, 5 to 14 for sands.
- Specify sediment simulation start time – Sets the start time for the sediment simulation.
- Sediment simulation start time – Enter the start time for the sediment simulation.
TUFLOW FV
New interface
UGrid Module
- New Create Cross Sections tool (add to: SMS:UGrid_Module#UGrid_Tools):
Create Cross Sections
The Create Cross Section ![]() tool is used to manually generate cross sections on a unstructured grid. This allows viewing the stratigraphy along the layers of an unstructured grid when rotating the grid.
tool is used to manually generate cross sections on a unstructured grid. This allows viewing the stratigraphy along the layers of an unstructured grid when rotating the grid.
To use the tool, make sure the UGrid is in plan view then click on one side of the grid followed by click on another side to create a cross section between the two points. When created successfully, a line will appear in the Graphics Window showing the location of the cross section. A cross section item will also appear in the Project Explorer.
Right-click on the cross section item in the Project Explorer has the following menu options:
- Display Options – Opens the Cross Section Options dialog.
- Remove – Deletes the cross section from the project. Removes the cross section from both the Project Explorer and Graphics Window.
Cross Section Options
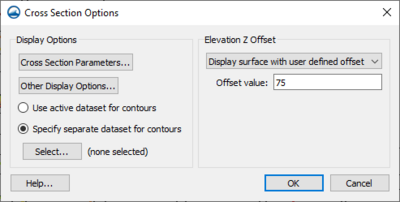
The Cross Section Options dialog contain options for how cross sections are displayed. It is reached through the right-click menu of a cross section item in the Project Explorer. The options are only set for the cross section selected when accessing these option.
The dialog has the following options:
- Display Options – This section contains options for changing how the cross section is displayed.
- Cross Section Parameters – Opens the UGrid Cross Section Parameters dialog.
- Other Display Options – Opens the Cross Section Other Options dialog.
- Use active dataset for contours – With this option, contours on the cross section will follow those of the selected active dataset on the UGrid.
- Specify separate dataset for contours – This options allows the user to define which dataset will be used for the contours. This allows the dataset contours of the cross section to be different than the active dataset of the UGrid.
- Select – Open the Select Scalar Dataset dialog where a dataset in the project can be chosen.
- Elevation Z Offset – Options in this section
- "Display surface at location" – Sets the elevation offset to be at the location of the cross section (no offset).
- "Display surface above geometry" – Sets the offset to be just above the geometry elevation.
- "Display surface with user defined offset" – Set the offset to a distance specified by the user.
- Offset value – Enter an elevation Z offset value.
UGrid Cross Section Parameters
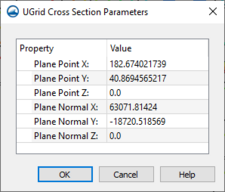
The '"UGrid Cross Section Parameters dialog is accessed through the Cross Section Options dialog. This dialog shows the location values of the cross section.
Cross Section Other Options
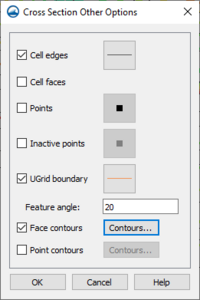
The Cross Section Other Options dialog is reached through the Cross Section Options dialog. This dialog contains additional options for adjusting the cross section display. The dialog has the following options:
- Cell edges – Turn on to display cell edge lines on the cross section. Clicking the button next to this option will open the Line Properties dialog.
- Cell faces – Turn on to display cell faces on the cross section.
- Points – Turn on to display points along the cross section. Clicking the button next to this option will open the Symbol Attributes dialog.
- Interactive points – Turn on to display interactive points along the cross section. Clicking the button next to this option will open the Symbol Attributes dialog.
- UGrid boundary – Turn on to display grid boundary line on the cross section. Clicking the button next to this option will open the Line Properties dialog.
- Feature angle – Enter the feature angle value for the cross section.
- Face contours – Turn on to see contours on the faces of the cross section. Clicking the button next to this option will open the Contour Options dialog.
- Point contours – Turn on to see contours on the points of the cross section. Clicking the button next to this option will open the Contour Options dialog.


